Analysis of transactions in the GBP / USD pair
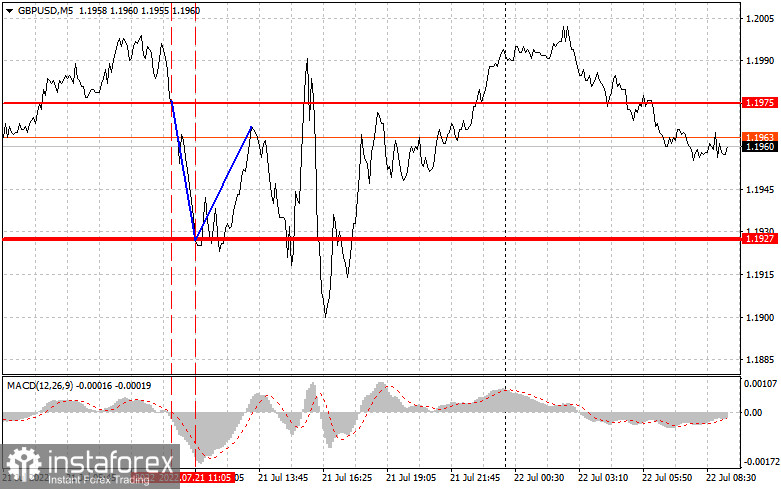
GBP/USD tested 1.1975. At that time, the MACD line had just started to move below zero, which is a good signal to sell. Without a doubt, taking short positions was correct because the pair fell in price by about 48 pips. Sometime later, the pair tested 1.1927. This time, the signal was to buy, which led to a price increase of more than 30 pips. No other signals appeared for the rest of the day.

The lack of important statistics in the UK led to sell-offs in GBP/USD yesterday. However, today, there may be an attempt to return to weekly highs if the reports on business activity in show strong numbers. Weak data, meanwhile, will increase the pressure on pound. In the afternoon, exactly the same reports will be released in the US, but this time, they will certainly boost dollar demand as their figures are likely to exceed forecasts.
For long positions:
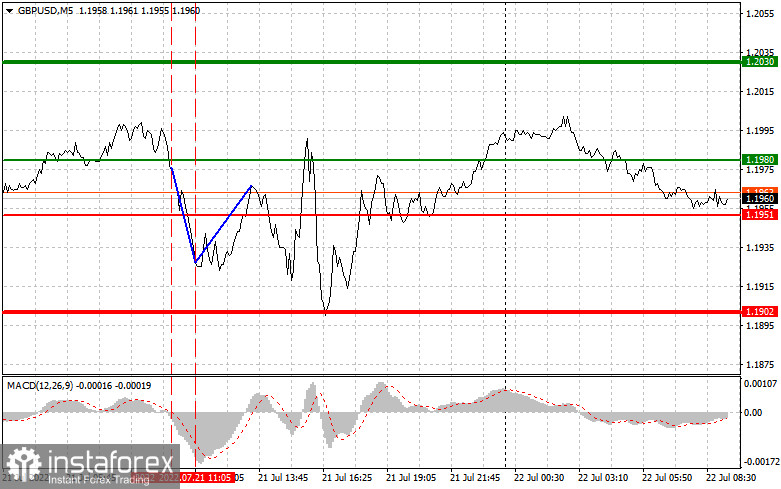
Buy pound when the quote reaches 1.1980 (green line on the chart) and take profit at the price of 1.2030 (thicker green line on the chart). There is a chance for a rally today, but only if upcoming UK data exceed expectations.
Take note that when buying, the MACD line should be above zero or is starting to rise from it. It is also possible to buy at 1.1951, but the MACD line should be in the oversold area as only by that will the market reverse to 1.1980 and 1.2030.
For short positions:
Sell pound when the quote reaches 1.1951 (red line on the chart) and take profit at the price of 1.1902. Pressure will return amid weak reports on the UK economy and update of 1.1951
Take note that when selling, the MACD line should be below zero or is starting to move down from it. Pound can also be sold at 1.1980, but the MACD line should be in the overbought area, as only by that will the market reverse to 1.1951 and 1.1902.

What's on the chart:
The thin green line is the key level at which you can place long positions in the GBP/USD pair.
The thick green line is the target price, since the quote is unlikely to move above this level.
The thin red line is the level at which you can place short positions in the GBP/USD pair.
The thick red line is the target price, since the quote is unlikely to move below this level.
MACD line - when entering the market, it is important to be guided by the overbought and oversold zones.
Important: Novice traders need to be very careful when making decisions about entering the market. Before the release of important reports, it is best to stay out of the market to avoid being caught in sharp fluctuations in the rate. If you decide to trade during the release of news, then always place stop orders to minimize losses. Without placing stop orders, you can very quickly lose your entire deposit, especially if you do not use money management and trade large volumes.
And remember that for successful trading, you need to have a clear trading plan. Spontaneous trading decision based on the current market situation is an inherently losing strategy for an intraday trader.
 English
 Русский
 Bahasa Indonesia
 Bahasa Malay
 ไทย
ไทย Español
 Deutsch
 Български
 Français
 Tiếng Việt
 中文
中文 বাংলা
বাংলা हिन्दी
 Čeština
 Українська
 Română

