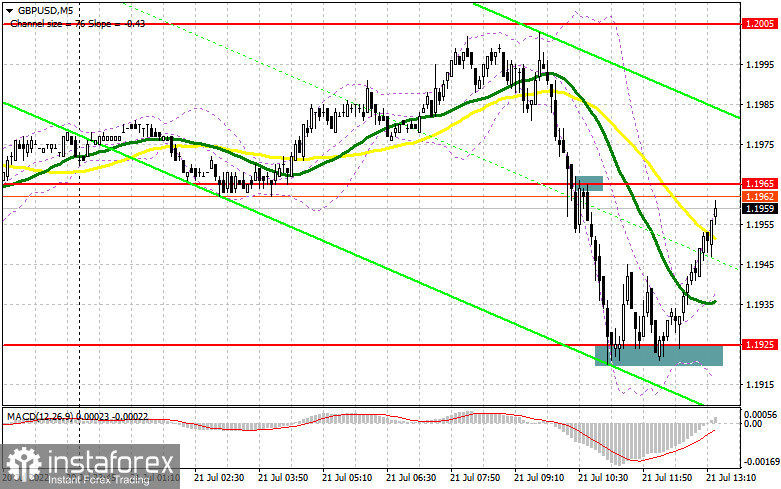
In the morning, the focus was on a few signals, with entry points considered from this level. Let's turn to the 5-minute chart to get a picture of what happened in the market. A nice sell signal was made after a breakout and a test of 1.1965 support. It triggered a sell-off to the range of 1.1925, producing a profit of about 40 pips. Traders managed to protect 1.1925. A few false breakouts created a buy entry point. At the moment of writing, GBP/USD rose by 40 pips.

When to go long on GBP/USD:
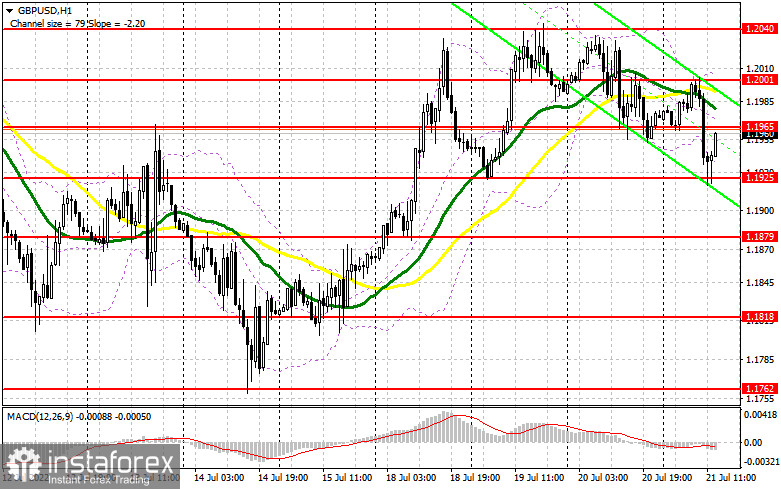
Today's volatility of GBP/USD partially depends on the ECB's interest rate decision. A stronger euro will drive the pound up. Meanwhile, in case of a weaker euro, the sterling will enter a downward correction. GBP traders will also focus their attention on US macro data. Should figures come in strong, pressure on GBP will increase. In such a case, the pair is likely to retest support at 1.1925. Long positions could be considered after a false breakout of the low, with the target at 1.1988, in line with bearish MAs. Bulls will do everything they can to close above the mark. A strong bullish impulse could be made after a breakout and a top-bottom retest of the 1.1988 level. If this assumption is accurate, the price might go towards 1.2081 and 1.2119, where profit taking should be considered. A more distant target stands close to 1.2160. Should GBP/USD fall and bullish activity decrease at 1.1925, pressure on GBP will rise. In such a case, it would be wiser to look for long entry points after a false breakout at 1.1879. Long positions could also be opened after a bounce from 1.1818 or 1.1762, allowing a 30-35 pips intraday correction.
When to go short on GBP/USD:
A false breakout at 1.1988 resistance may allow traders to sell the instrument. Bulls may open more long positions and extend the uptrend if quotes get out of the range. Positive macro results in the US are likely to exert pressure on the pair. In such a case, the target will stand at 1.1925 support. If there is no bullish activity near the level and GBP/USD consolidates below 1.1925, an additional sell entry point will be made after a bottom-top retest of the mark, with the target at 1.1879. This is where profit taking should be considered. A more distant target stands close to 1.1818. Should GBP/USD rise and bearish activity decrease at 1.1988, it would be wiser to look for short entry points after a false breakout at the 1.2040 weekly high. If there is no trading activity at this level, a rebound might occur. In such a case, short positions should be postponed until levels 1.2081 and 1.2119 are reached. If so, GBP/USD could be sold on a bounce, allowing a 30-35 pips intraday correction.

Commitments of Traders:
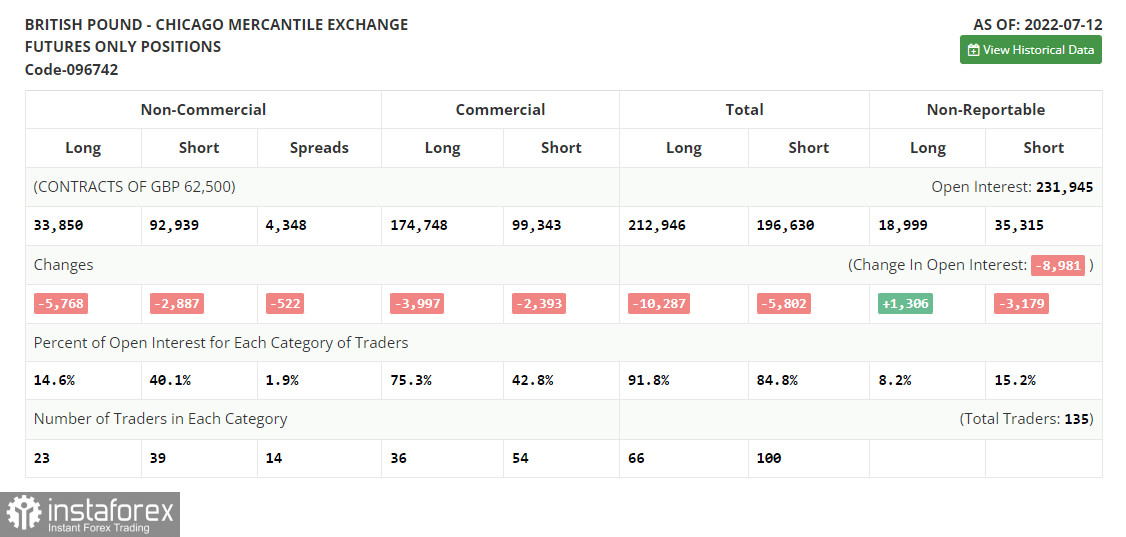
The COT report for July 12 logged a decrease in both long and short positions. The negative delta increased. Another attempt to buy the pair at yearly lows failed although traders started to take profit at the end of the week, encouraged by the strong macroeconomic data from the US. As a result, a small correction occurred. The cost of living crisis in the UK is getting more acute every day, and the government is struggling to cope with it. At the same time, the Fed's policy and the pace of monetary tightening in the US provide significant support to the US dollar and put more pressure on the pound. The US regulator is expected to raise the rate by 1.0% at the next meeting. According to the COT report, the long positions of the non-commercial traders decreased by 5,768 to 33,850, while short positions declined by 2,887 to 92,939.The negative non-commercial net position increased to -59,089 from -56,208. The weekly closing price dropped to 1.1915 from 1.1965.

Indicator signals:
Moving averages
Trading is carried out below the 30-day and 50-day moving averages, showing bears' attempts to regain control over the market.
Note: The period and prices of moving averages are viewed by the author on the hourly chart and differ from the general definition of classic daily moving averages on the daily chart.
Bollinger Bands
Resistance is seen at 1.2005, in line with the upper band.
Indicator description:
- Moving average (MA) determines the current trend by smoothing volatility and noise. Period 50. Colored yellow on the chart.
- Moving average (MA) determines the current trend by smoothing volatility and noise. Period 30. Colored green on the chart.
- Moving Average Convergence/Divergence (MACD). Fast EMA 12. Slow EMA 26. SMA 9.
- Bollinger Bands. Period 20
- Non-commercial traders are speculators such as individual traders, hedge funds, and large institutions who use the futures market for speculative purposes and meet certain requirements.
- Long non-commercial positions are the total long position of non-commercial traders.
- Non-commercial short positions are the total short position of non-commercial traders.
- Total non-commercial net position is the difference between short and long positions of non-commercial traders.
 English
 Русский
 Bahasa Indonesia
 Bahasa Malay
 ไทย
ไทย Español
 Deutsch
 Български
 Français
 Tiếng Việt
 中文
中文 বাংলা
বাংলা हिन्दी
 Čeština
 Українська
 Română

