EUR/USD

Higher timeframes
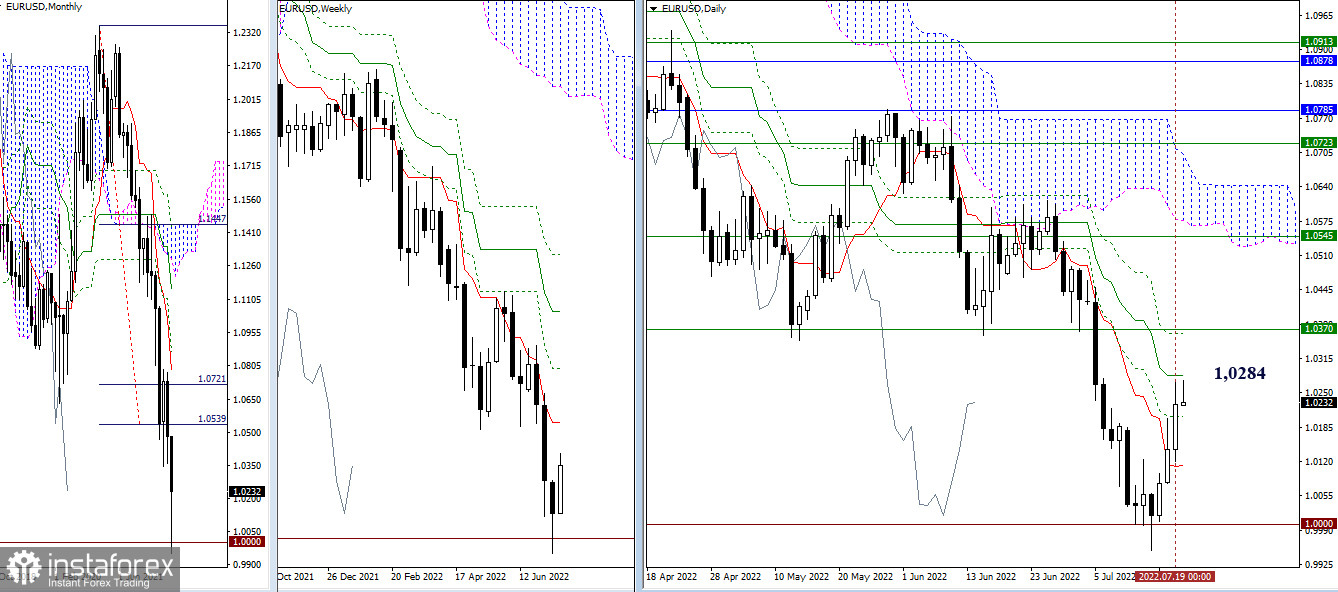
There are no significant changes yet. The pair is currently on the outskirts of the daily medium-term trend (1.0284), working in its zone of influence and attraction. The break of the level opens the possibility of testing the levels of 1.0362 (the final level of the daily death cross) and 1.0370 (the weekly short-term trend). The result of interaction with these levels will determine further prospects for movement. If the upward correction is limited by the daily medium-term trend (1.0284), then in the process of restoring the downward trend (local low 0.9952), the supports 1.0205 (Fibo Kijun) – 1.0112 (Tenkan) - 1.0000 (psychological level) may come into operation.

H4 – H1
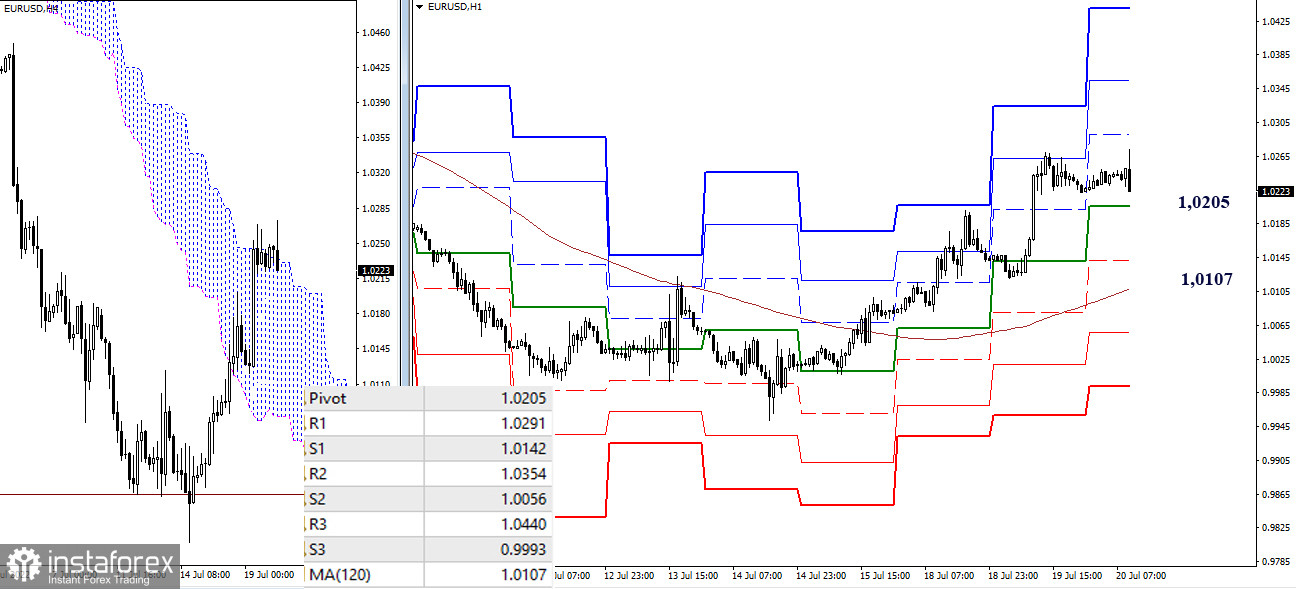
Bulls currently dominate the lower timeframes. Their intraday targets today are located at 1.0291 – 1.0354 – 1.0440 (resistance of classical pivot points). The key supports of the lower timeframes in the current situation will defend the interests of the bulls at the levels of 1.0205 (central pivot point of the day) and 1.0107 (weekly long-term trend). Consolidation below can change the current balance of power.
***
GBP/USD

Higher timeframes
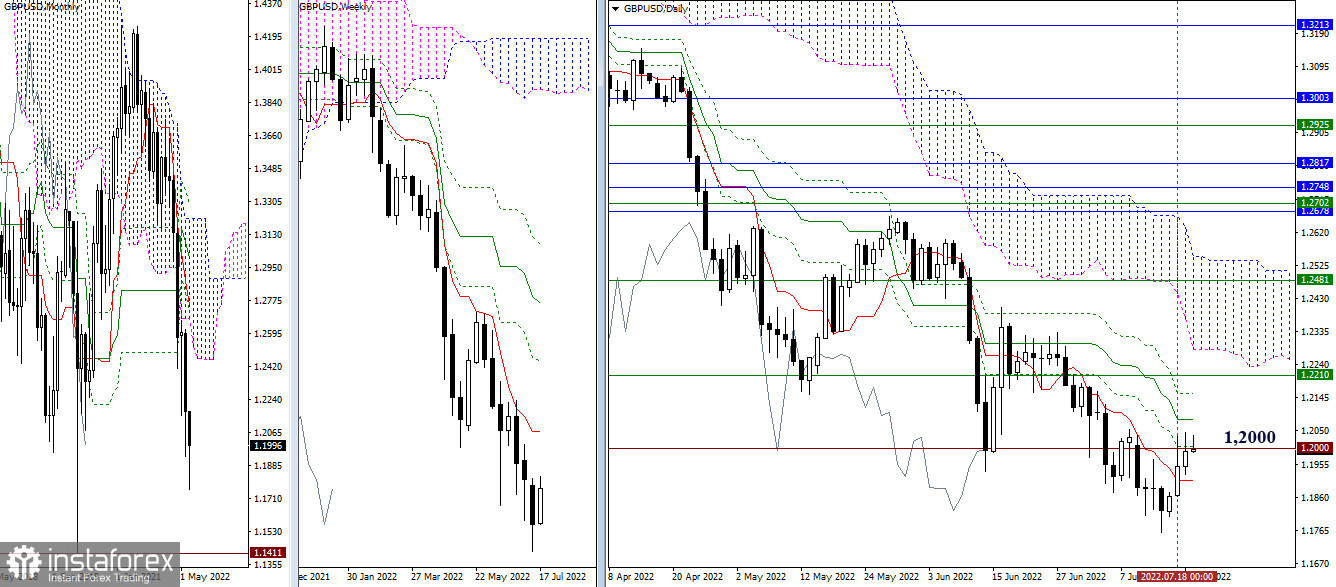
Yesterday, bulls failed to consolidate above 1.2000. The battle for the level continues. At the same time, bullish players will continue to be interested in 1.2082 (daily medium-term trend) and 1.2210 (weekly short-term trend), and bearish players, in case of activity, will focus on passing 1.1907 (daily short-term trend) and 1.1759 (local low).

H4 – H1
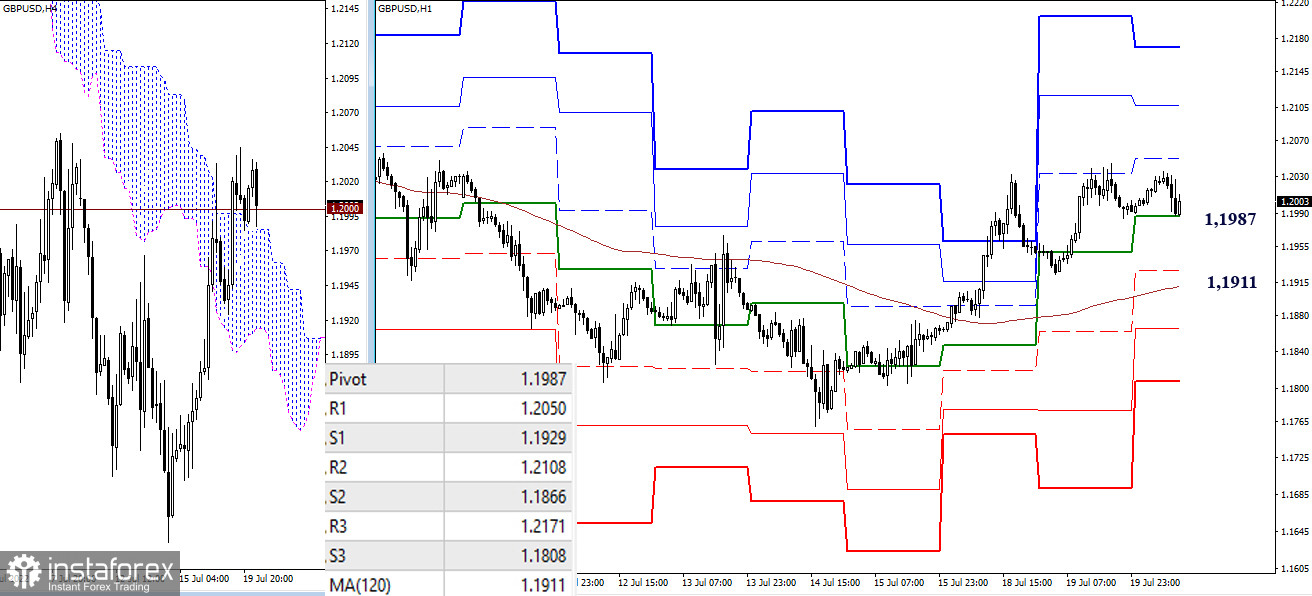
The main advantage in the lower timeframes is currently on the bulls, but there is no activity and effectiveness on their part yet. Upward targets within the day today can be noted at 1.2050 – 1.2108 – 1.2171 (resistance of the classic pivot points). Now the support of the central pivot point of the day (1.1987) is being tested, then the level of the weekly long-term trend (1.1911) will be important. Its breakdown and the reversal of the moving average will change the current balance of power in favor of bears. Additional targets for bearish activity are 1.1866 (S2) and 1.1808 (S3).
***
In the technical analysis of the situation, the following are used:
higher timeframes – Ichimoku Kinko Hyo (9.26.52) + Fibo Kijun levels
H1 - Pivot Points (classic) + Moving Average 120 (weekly long-term trend)
 English
 Русский
 Bahasa Indonesia
 Bahasa Malay
 ไทย
ไทย Español
 Deutsch
 Български
 Français
 Tiếng Việt
 中文
中文 বাংলা
বাংলা हिन्दी
 Čeština
 Українська
 Română

