USD/JPY:

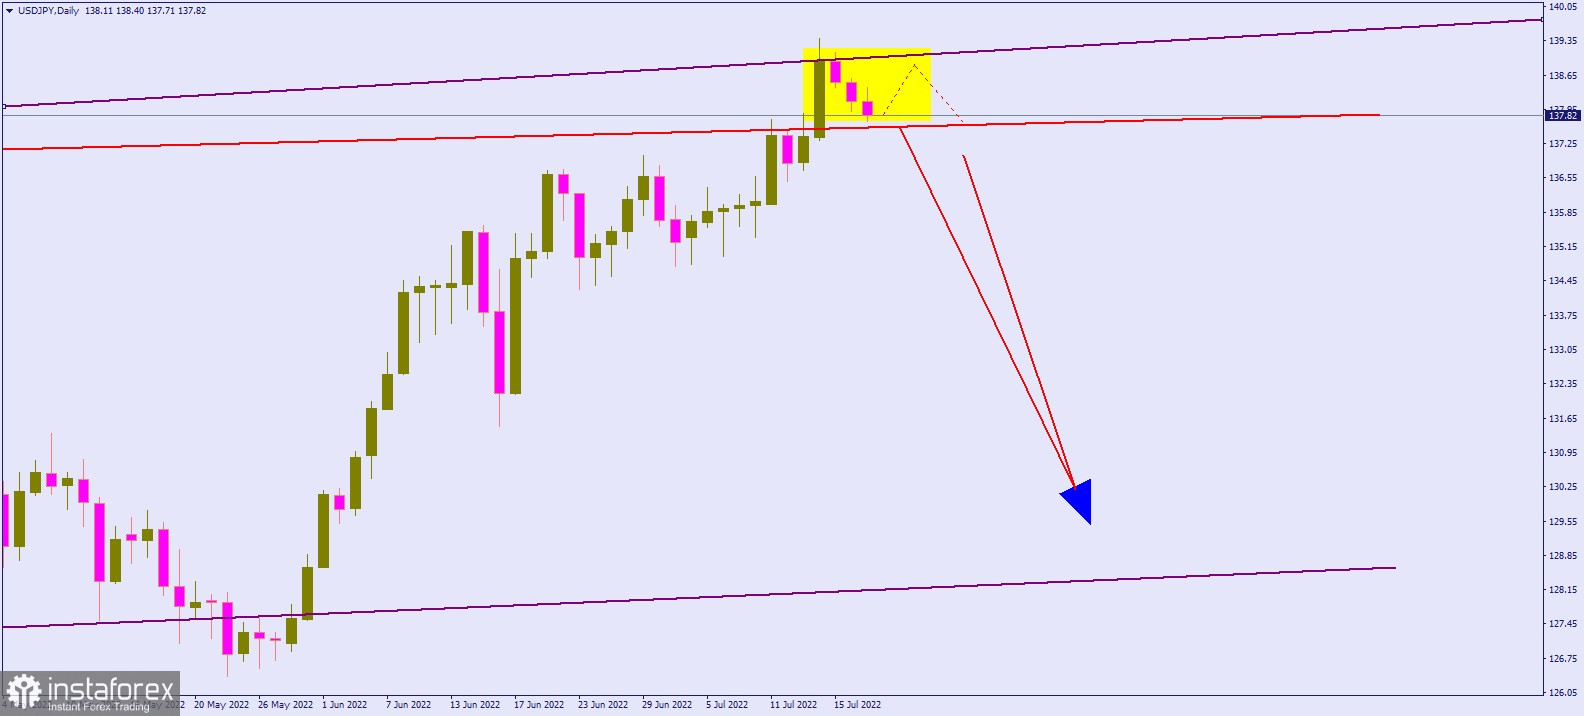
The chart shows the movement of USD/JPY in the daily (D1) chart.
It seems that dollar has reached its highest, 139.38, and is ready for a reversal.
The yellow rectangle mark on the chart indicates the possible area for it.
The breakdown of the support level, which is 137.5, will signal a new trend.
Meanwhile, the breakdown of the resistance level, which is 139.8 -140.0, will signal that a rebound will not happen and dollar will continue to rise.
 English
 Русский
 Bahasa Indonesia
 Bahasa Malay
 ไทย
ไทย Español
 Deutsch
 Български
 Français
 Tiếng Việt
 中文
中文 বাংলা
বাংলা हिन्दी
 Čeština
 Українська
 Română

