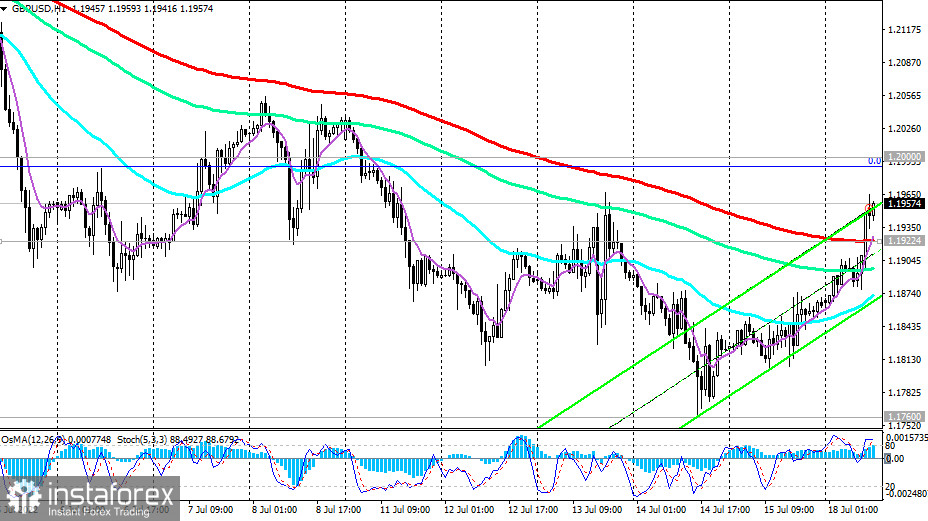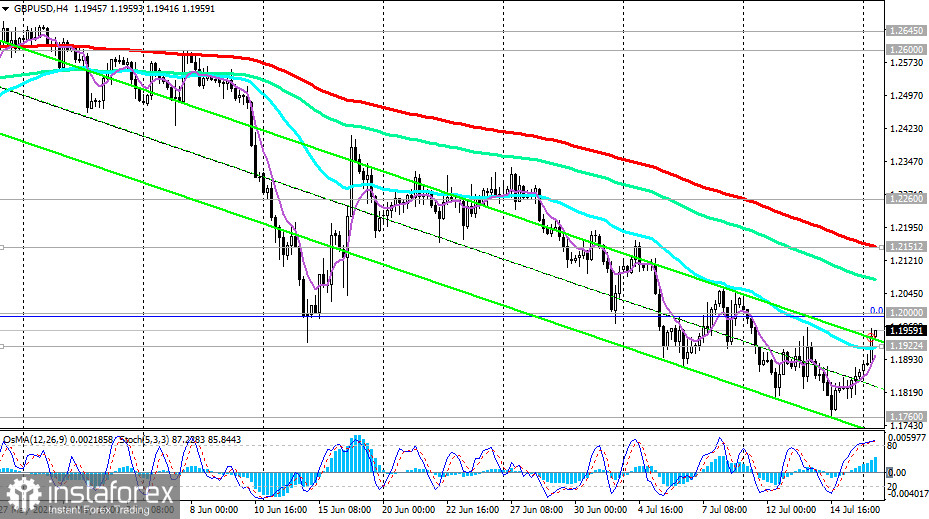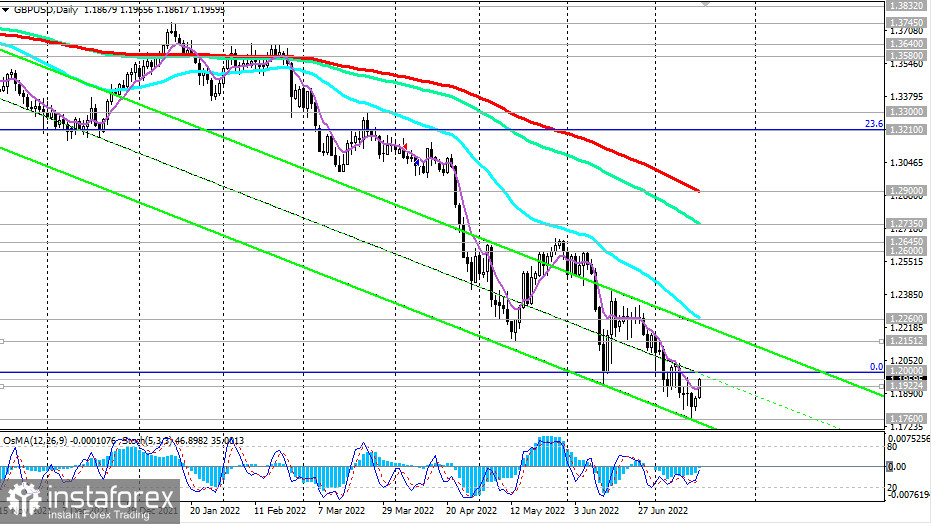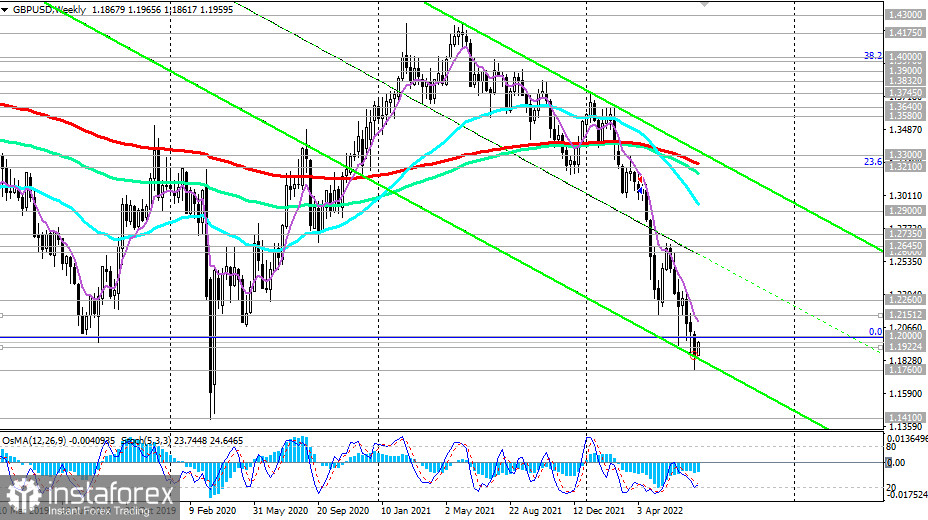
The GBP/USD is growing today, having received an impulse from the dollar, developing a downward correction.
As of this writing, GBP/USD is trading near the level of 1.1957, having broken through the important short-term resistance level of 1.1922 (200 EMA on the 1-hour chart) at the beginning of today's European session, thus placing an order for a possible continuation of growth.

If this upward correction continues, GBP/USD will move towards the resistance level of 1.2151 (200 EMA on the 4-hour chart) and break through 1.2200, through which the upper limit of the descending channel passes on the daily chart. The limit of the upward correction is around the resistance level of 1.2260 (50 EMA on the daily chart). The dynamics of GBP/USD is still dominated by bearish momentum, which forced the pair to update its more than 2-year low last week (since April 2020).

And since trends do not break so quickly, it is logical to assume the resumption of the downward dynamics of GBP/USD. And the trigger may be the publication (tomorrow or Wednesday) of important macro statistics for the UK if it turns out to be negative or weak.
In an alternative scenario, the growth of GBP/USD will continue above the resistance level of 1.2260. This scenario is unlikely, but it still has the right to be, especially if very weak macro data comes from the US, although there are not so many of them this week.

In the main scenario, we expect a resumption of the decline either near the local resistance level of 1.2000 or near the levels of 1.2075, 1.2100, 1.2150. Therefore, it would be logical to place pending orders (Sell Limit) for sale here.
A confirmation signal will be a breakdown of the support level of 1.1922.
Support levels: 1.1922, 1.1900, 1.1800, 1.1760
Resistance levels: 1.2000, 1.2151, 1.2260, 1.2400, 1.2600, 1.2645, 1.2700, 1.2735, 1.2900, 1.3000, 1.3100, 1.3210, 1.3300
Trading Tips
Sell Stop 1.1930. Stop-Loss 1.2015. Take-Profit 1.1900, 1.1800, 1.1760, 1.1700
Buy Stop 1.2015. Stop-Loss 1.1930. Take-Profit 1.2100, 1.2151, 1.2260, 1.2400, 1.2600, 1.2645, 1.2700, 1.2735, 1.2900, 1.3000, 1.3100, 1.3210, 1.3300
 English
 Русский
 Bahasa Indonesia
 Bahasa Malay
 ไทย
ไทย Español
 Deutsch
 Български
 Français
 Tiếng Việt
 中文
中文 বাংলা
বাংলা हिन्दी
 Čeština
 Українська
 Română

