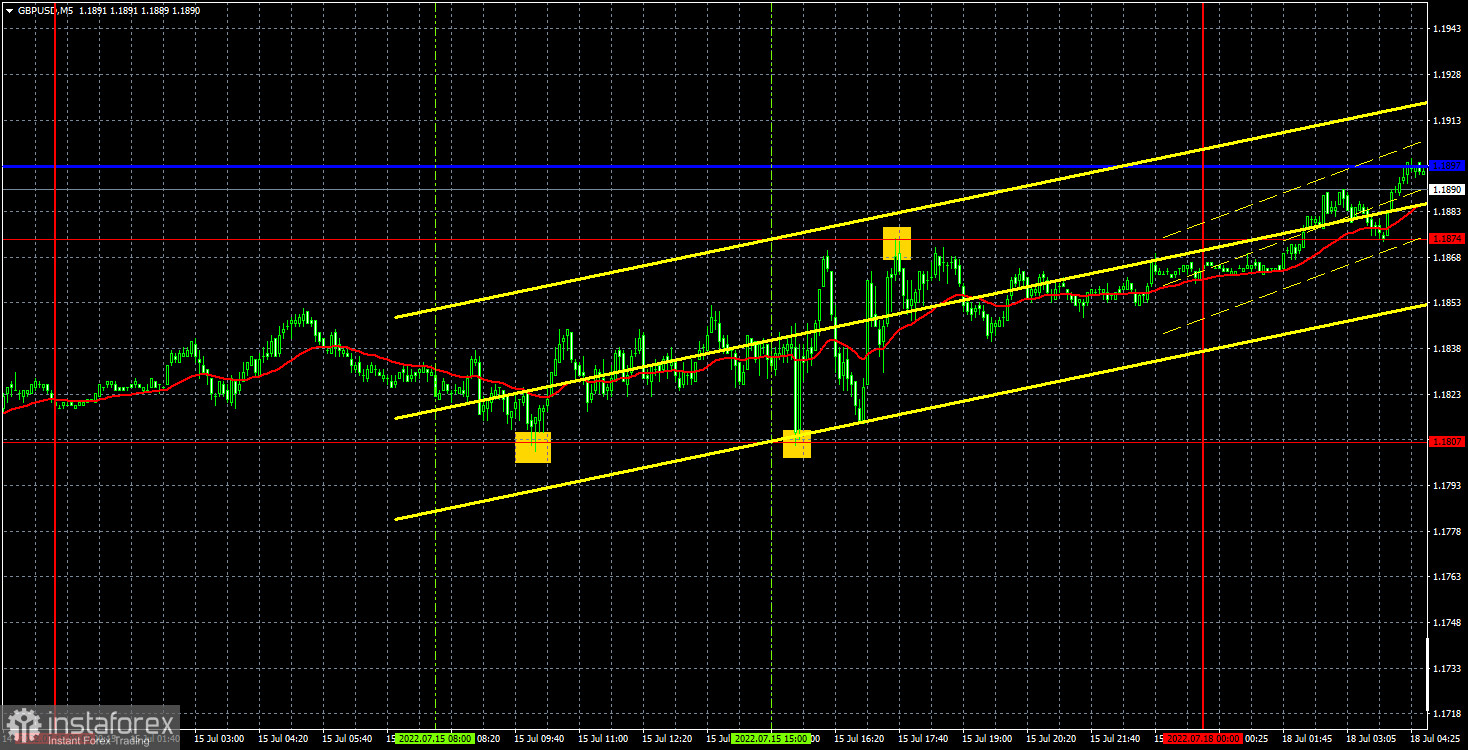
M5 chart of GBP/USD

On Friday, the movement of GBP/USD was similar to that of EUR/USD. Quotes were mostly rising during the day. Traders were still reluctant to invest in GBP. At the opening of the North American session, the release of three macro reports in the US triggered market jitters. However, volatility turned out to rater low, just 50-60 pips. All in all, the market showed no reaction to the results on US retail sales, industrial production, and consumer sentiment. By the end of the day, the pair approached the critical line. The pair has not broken through the line yet. Likewise, it has not reached the previous swing high yet. Therefore, a correction is highly unlikely.
As for trading signals, GBP bounced off 1.1807 at the opening of the European session. So, it was time to go long. However, such trades brought no profit, and the pair returned to 1.1807 at the beginning of the North American session. Another rebound occurred and long positions were opened. This time, the price approached 1.1874 and pulled back. Long positions were closed with a profit of some 30-40 pips. The final sell signal was formed rather late, so it was pointless to go short.
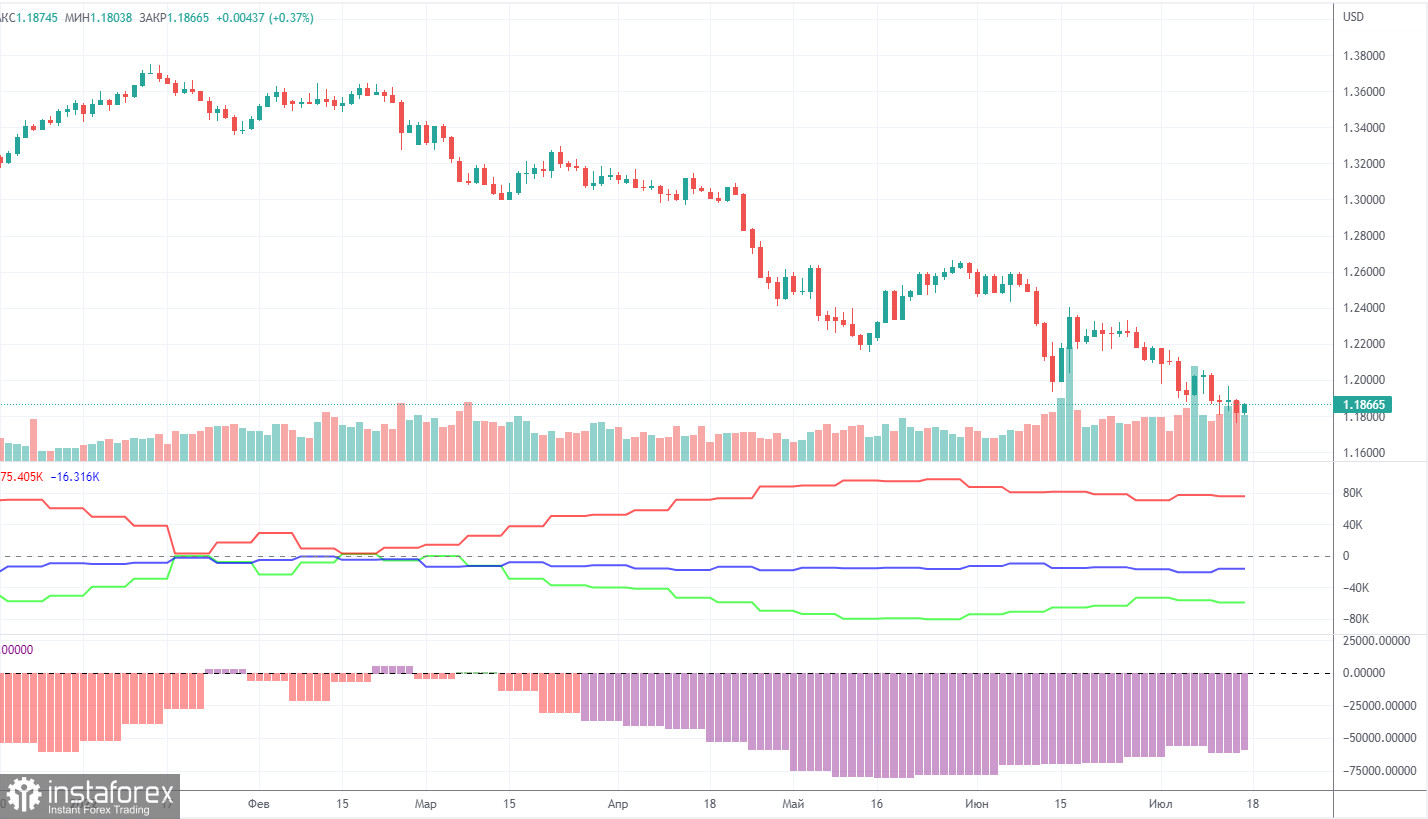
COT report:

The latest COT report revealed some changes. During the reporting week, non-commercial traders closed 5.7K long positions and 2.8K short ones. The net position increased by 2.9K. Sentiment is still bearish, according to Indicator 2 on the chart. There has been no strong upward correction so far. The net position was bearish for 3 months and then rose slightly. However, it does not matter because the pound is still falling versus the dollar. Demand for the dollar is still rather high. Therefore, for GBP to strengthen, demand for it should be rising faster than that for the greenback. Non-commercial traders now hold 93K short positions and just 34K long ones. Neither macro statistics nor fundamental factors support the British currency. The corrective move upward may extend. In the medium term, the downtrend is likely to extend.
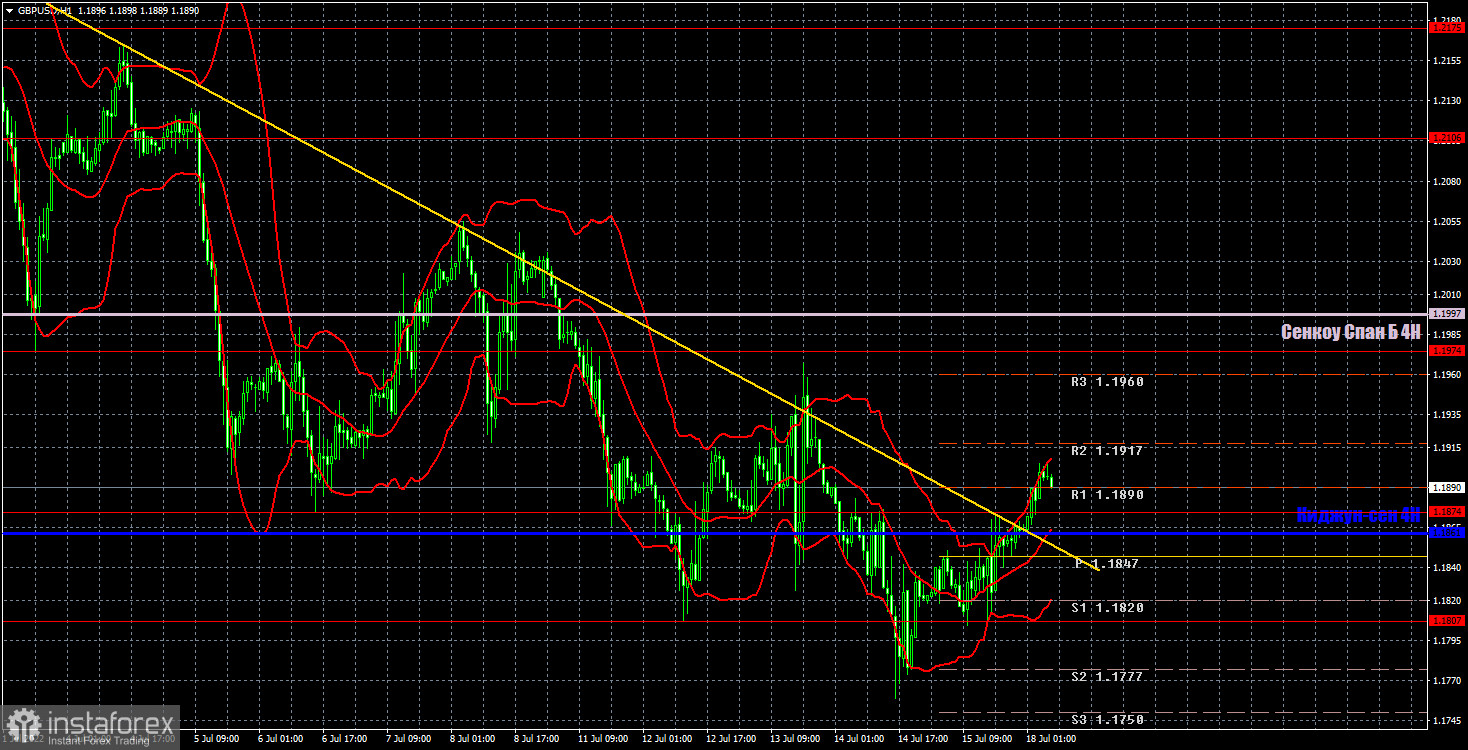
H1 chart of GBP/USD

In the H1 time frame, GBP broke the descending trend line. So, the currency now has slightly higher growth potential. Neither the fundamental nor geopolitical background has changed lately. Currently, there are some technical buy signals, but they mean little because a sell-off may start at any moment. On June 18, important levels are seen at 1.1807, 1.1874, 1.1974, 1.2106, 1.2175 as well as 1.1997 (Senkou Span B) and 1.1861 (Kijun-sen). Signals are made whenever the price bounces or breaks through extreme levels. Don't forget to place a stop-loss order at the breakeven point when the price passes 20 pips in the right direction. Ichimoku indicator lines can move during the day, which should be taken into account when determining trading signals. Support and resistance can be used for profit taking. On Monday, the macroeconomic calendar contains no important releases in the UK and the US. So, traders will have nothing to react to. Nevertheless, a sideways movement is unlikely today.
Indicators on charts:
Resistance and support are thick red lines, near which the trend may stop. They do not make trading signals.
The Kijun-sen and Senkou Span B lines are the Ichimoku indicator lines moved to the hourly timeframe from the 4-hour timeframe. They are also strong lines.
Extreme levels are thin red lines, from which the price used to bounce earlier. They can produce trading signals.
Yellow lines are trend lines, trend channels, and any other technical patterns.
Indicator 1 on the COT chart shoe the size of the net position of each trader category.
Indicator 2 on the COT chart reflects the size of the net position for the Non-commercial group of traders.
 English
 Русский
 Bahasa Indonesia
 Bahasa Malay
 ไทย
ไทย Español
 Deutsch
 Български
 Français
 Tiếng Việt
 中文
中文 বাংলা
বাংলা हिन्दी
 Čeština
 Українська
 Română

