Technical outlook:
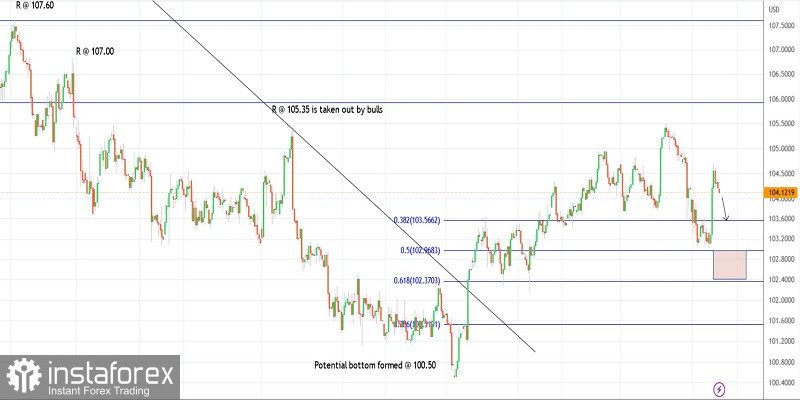
The US dollar index slipped through 104.50 during the New York session on Wednesday as discussed earlier. The index is seen to be trading close to 104.10 at this point in writing as the bears remain inclined to come back in control intraday. Interim support is now in place at 103.00 and the bullish structure will remain intact until it holds well.
The US dollar index is currently working on its larger-degree rally between 100.50 and 105.50 as seen on the 4H chart here. The bears have been successful to drag prices lower towards 103.00, which is the Fibonacci 0.50 retracement of the above rally. Please note that the potential remains for a drag lower towards 102.50 if an Up Gartley is unfolding.
In that case, prices will test the Fibonacci 0.618 retracement around 102.50 before resuming its rally towards 106.50 and 109.00. Also, note that 102.50 is the Fibonacci 0.618 retracement of the above rally, hence the potential remains high for a bullish turn if prices manage to reach there. The overall direction remains higher against 100.50.
Trading idea:
A potential rally towards 106.00 and 109.00
Good luck!
 English
 Русский
 Bahasa Indonesia
 Bahasa Malay
 ไทย
ไทย Español
 Deutsch
 Български
 Français
 Tiếng Việt
 中文
中文 বাংলা
বাংলা हिन्दी
 Čeština
 Українська
 Română

