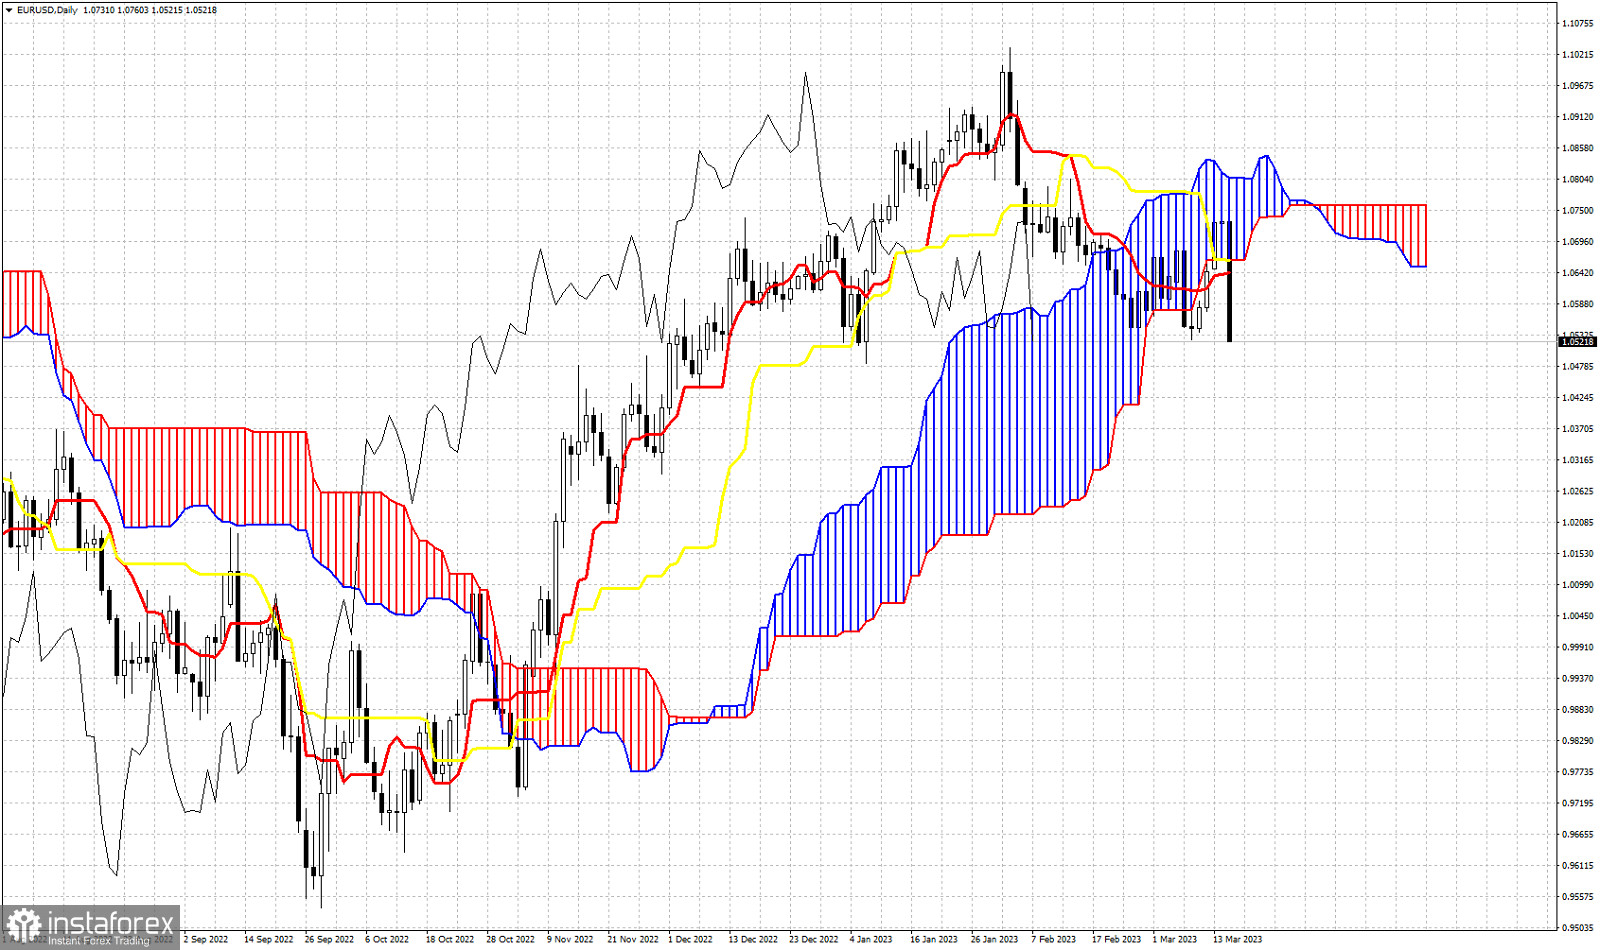
EURUSD is trading below 1.06 close to 1.0535 after getting rejected by the cloud resistance and by the 38% Fibonacci retracement. In our previous analysis we noted that price was trading around the 38% Fibonacci retracement level and that a rejection here would be a bearish sign. Price in the Daily chart has broken below the Kumo (cloud) and is also trading below the kijun-sen (yellow line indicator) and the tenkan-sen (red line indicator). The Chikou span (black line indicator) is below the candlestick pattern and it also got rejected once it touched the candlestick pattern (resistance). In order for trend to change to neutral from bearish, price must re-enter the cloud, in other words price must push above 1.0665.
 English
 Русский
 Bahasa Indonesia
 Bahasa Malay
 ไทย
ไทย Español
 Deutsch
 Български
 Français
 Tiếng Việt
 中文
中文 বাংলা
বাংলা हिन्दी
 Čeština
 Українська
 Română

