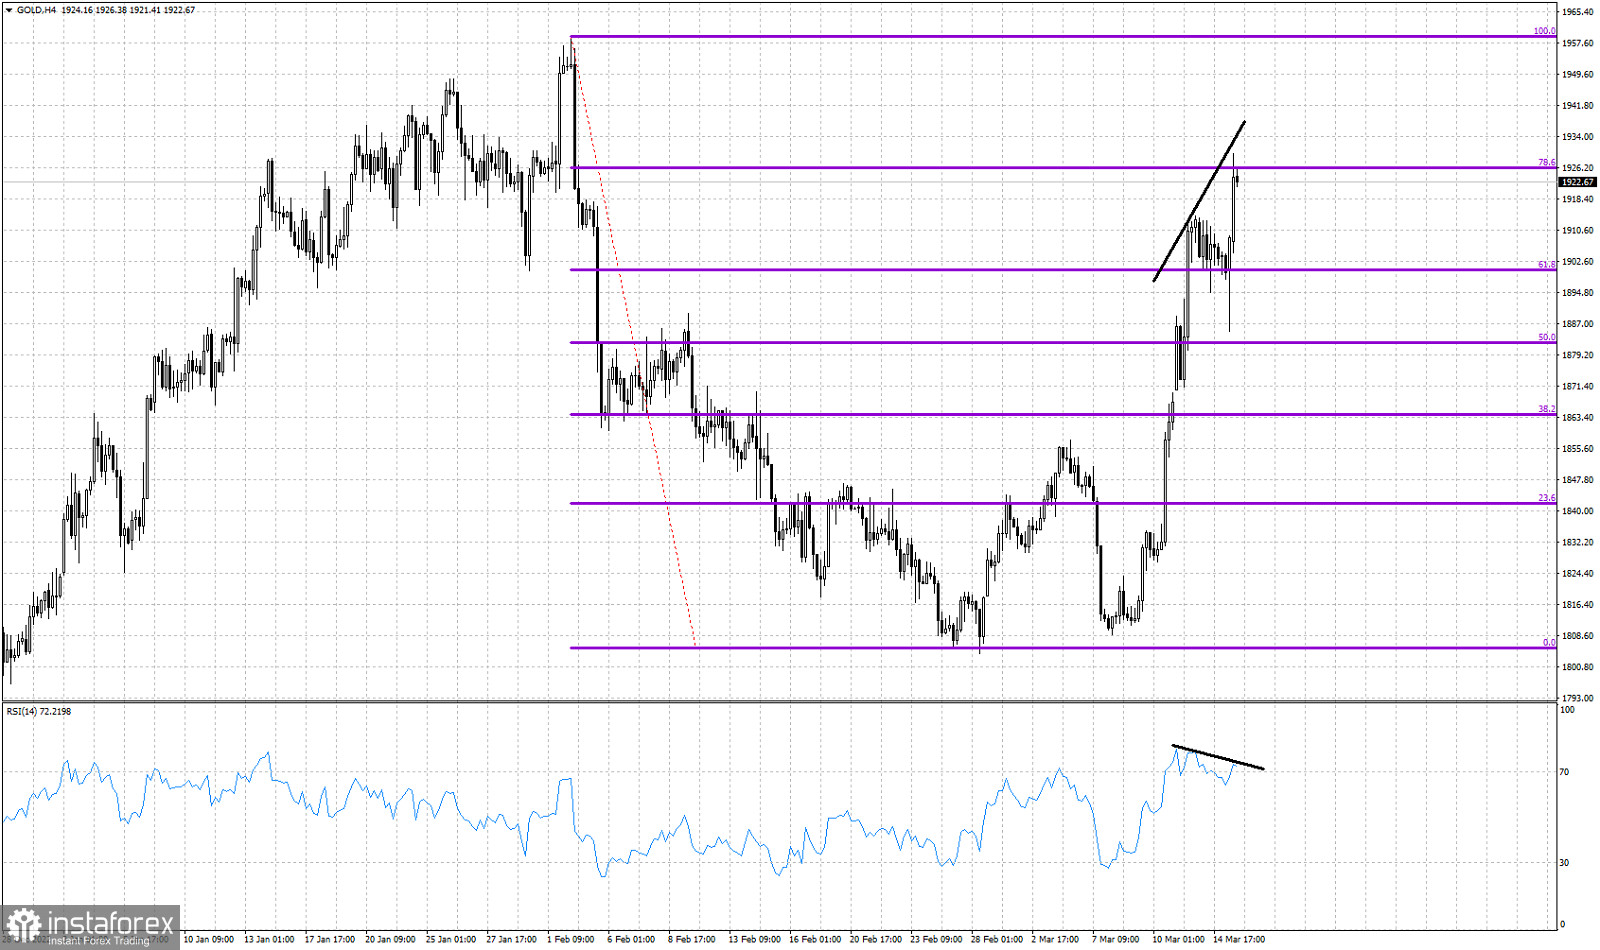
Violet lines- Fibonacci retracements
Black lines- Bearish RSI divergence
Gold price is making fresh new higher highs around $1,925. Price has managed to stay above the 61.8% Fibonacci level and is now challenging the 78.6% retracement. Short-term trend remains bullish as price is still making higher highs and higher lows. However there is an important warning by the RSI. The RSI is not making higher highs, on the contrary it is making lower highs. The RSI bearish divergence for the 2nd time with the RSI turning lower from overbought levels, is a very important warning that implies that the up trend could soon reverse. Bulls need to be very cautious. Support is found at $1,890-$1,900. A break below this level will signal a short-term trend change.
 English
 Русский
 Bahasa Indonesia
 Bahasa Malay
 ไทย
ไทย Español
 Deutsch
 Български
 Français
 Tiếng Việt
 中文
中文 বাংলা
বাংলা हिन्दी
 Čeština
 Українська
 Română

