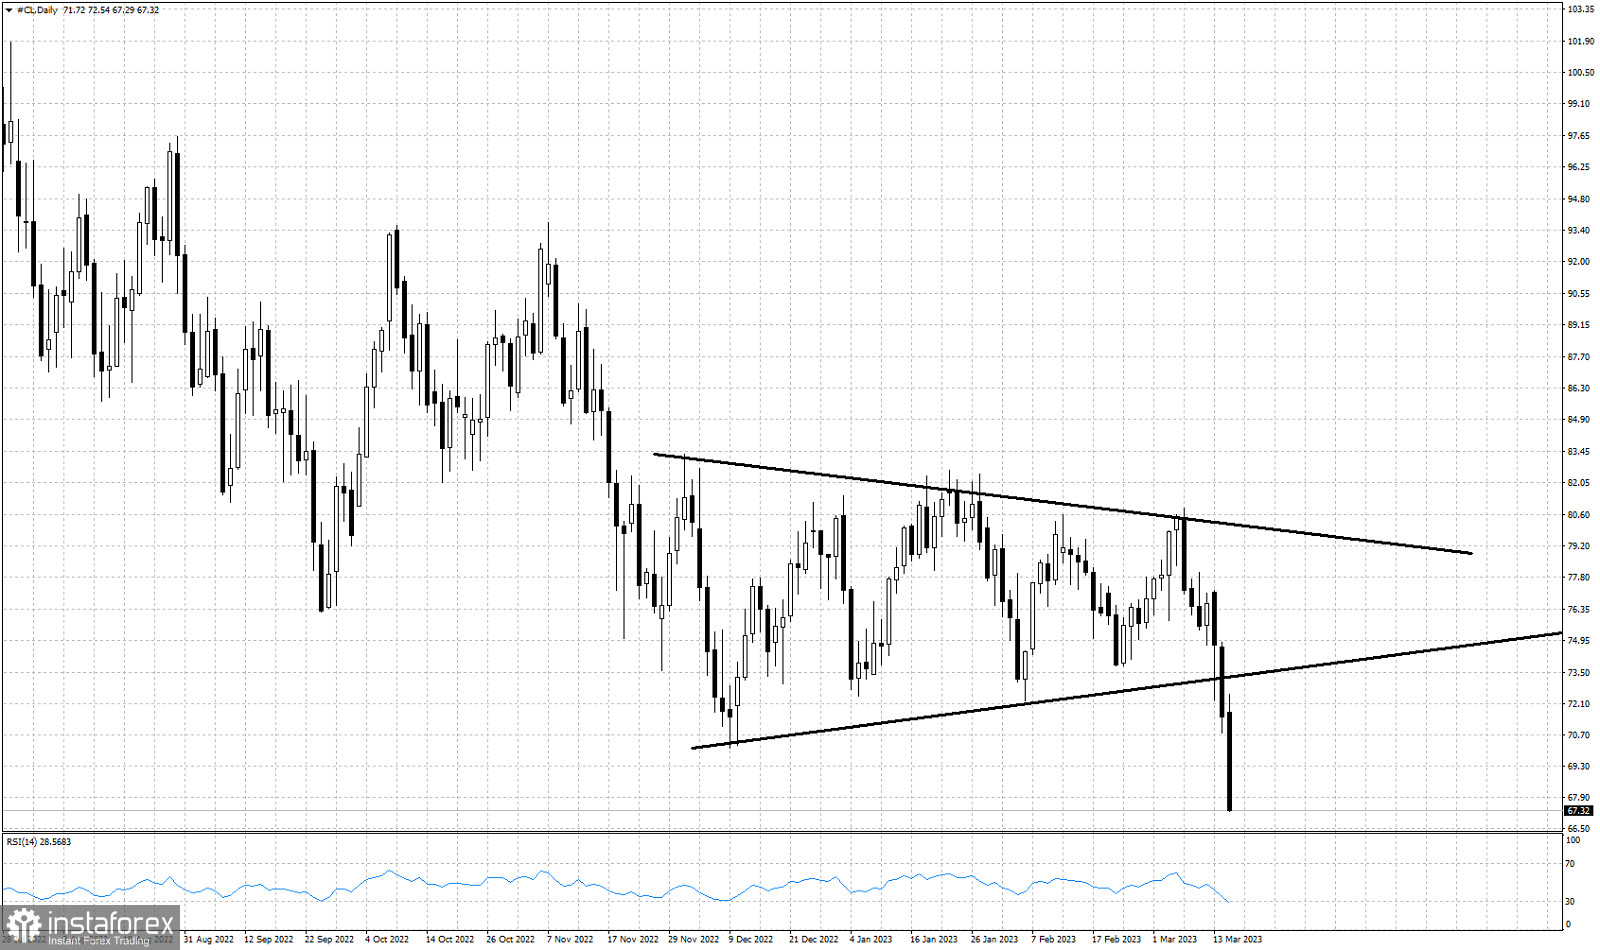
Black lines- triangle pattern (broken)
Oil price yesterday broke below the lower triangle boundary support at $73.35. Yesterday the daily candle closed at $71.50 while today price remains under pressure trading close to $67. Short-term trend remains bearish since the rejection at $80.93. The RSI is making new fresh lows and is approaching oversold levels. So far bears remain in control of the trend. In the near term we could see a bounce to back test the broken support at $73.
 English
 Русский
 Bahasa Indonesia
 Bahasa Malay
 ไทย
ไทย Español
 Deutsch
 Български
 Français
 Tiếng Việt
 中文
中文 বাংলা
বাংলা हिन्दी
 Čeština
 Українська
 Română

