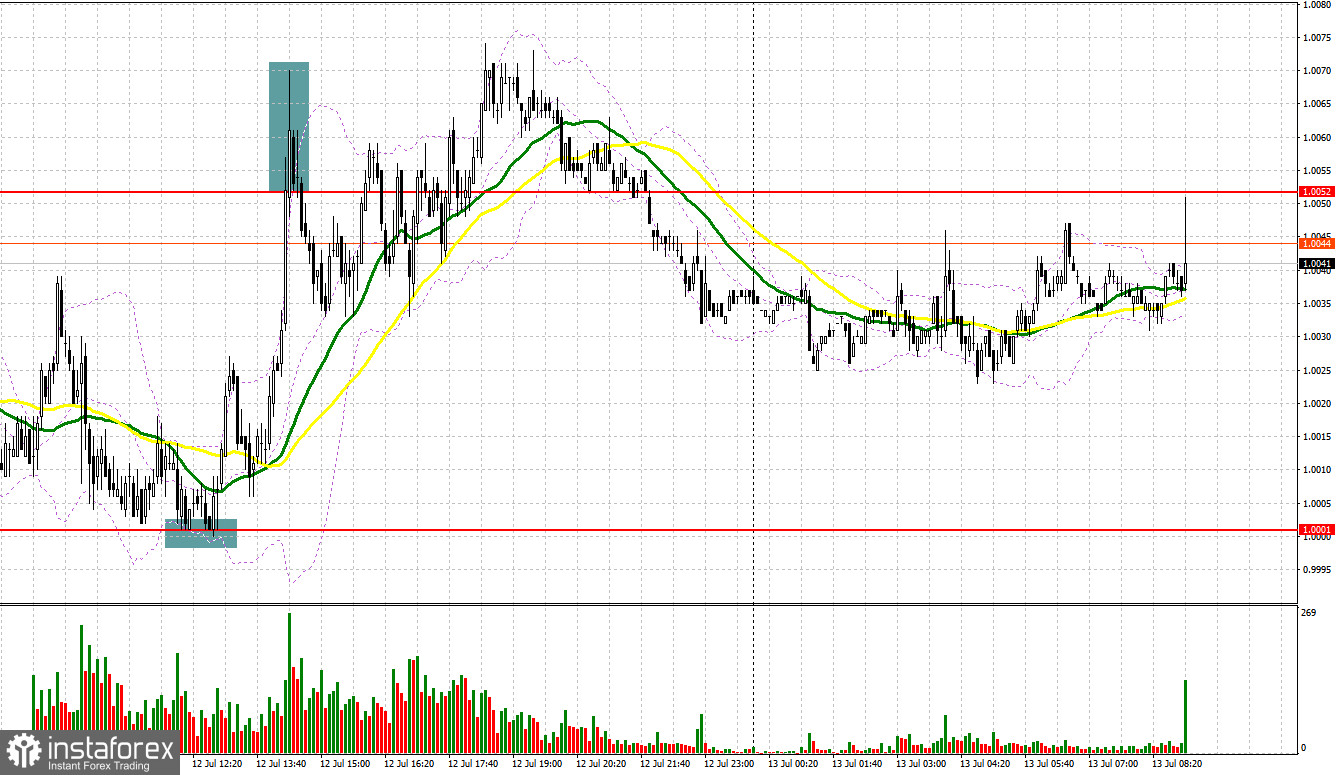
Several market entry signals were formed yesterday. I suggest you take a look at the 5-minute chart and figure out what happened. I paid attention to the 1.0001 level in my morning forecast and advised you to make decisions on entering the market. The pair's decline was not long in coming, especially after a sharp decline in the conditions and sentiment indexes from the German ZEW Institute. A false breakout at 1.0001 led to a buy signal, but after moving up by 25 points, we failed to receive additional support from big players. As a result, the euro fell and again approached parity against the US dollar. The pair's upward movement continued in the afternoon, and we managed to reach the resistance of 1.0052. An unsuccessful attempt to consolidate above and a false breakout - all this led to a sell signal and the pair moved down by 25 points.

When to go long on EUR/USD:
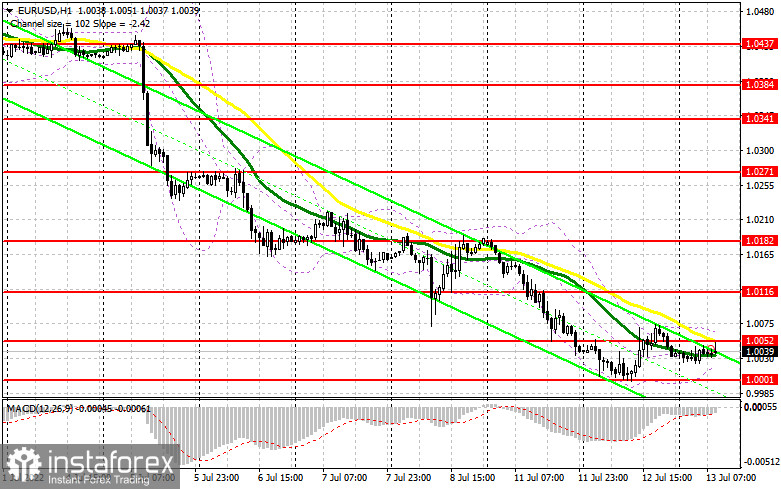
The euro corrected slightly against the US dollar, but there are no real bulls even at current lows. This is confirmed by an unsuccessful attempt to consolidate above 1.0052. A report on industrial production in the eurozone will be released in the morning, which may put pressure on the euro even before the US inflation report is published - a more negative actual value of the indicator is enough. In this case, as yesterday, bulls will have to defend the immediate support of 1.0001. If this level is updated only after forming a false breakout, you can count on some upward correction. The nearest target will be the resistance at 1.0052, where the average moving averages are playing on the bears' side. A breakthrough and test of this range would hit the stops, signaling long positions with the possibility of a larger increase to 1.0116. However, we can talk about the continuation of the upward correction only after the release of the US reports. The bears will try to build the upper limit of the downward channel at the level of 1.0116, so the growth will be clearly limited. A more distant target will be the area of 1.0182, where I recommend taking profits.
In case EUR/USD falls and there are no bulls at 1.0001, which is more likely, the pressure on the euro will seriously increase again. In this case, I advise you not to rush to enter the market: the best option for opening long positions would be a false breakout around 0.9958. I advise you to buy EUR/USD immediately on a rebound only from the level of 0.9915, or even lower - in the region of 0.9886, counting on an upward correction of 30-35 points within the day.
When to go short on EUR/USD:
Everyone will count on the euro's succeeding decline against the US dollar as long as trading is conducted below 1.0052. Hope for an upward rebound for the euro ahead of the US inflation report is maintained only by good data on the eurozone. In the case EUR/USD grows in the first half, forming a false breakout near the nearest resistance at 1.0052, by analogy with what I analyzed above, creates a signal to open short positions with the prospect of a further decline in EUR/USD and a return to support 1.0001, which is the last "stop" before the change in the parity of the euro against the dollar. A breakthrough and consolidation below this range, as well as a reverse test from the bottom up - all this will lead to another sell signal with the removal of bulls' stops and a larger movement of the pair down to the 0.9958 area. A breakthrough and consolidation below is a direct road to 0.9915, where I recommend completely leaving short positions. A more distant target will be the area of 0.9886.
In case EUR/USD moves up during the European session, as well as the absence of bears at 1.0052, I advise you to postpone short positions until the more attractive resistance of 1.0116, where the moving averages pass. A rebound down from this level will be provided even amid speculators' closure of long positions. Forming a false breakout at 1.0116 could be a new starting point for the continuation of the bear market. You can sell EUR/USD immediately on a rebound from the high of 1.0182, or even higher - in the area of 1.0271, counting on a downward correction of 30-35 points.

COT report:
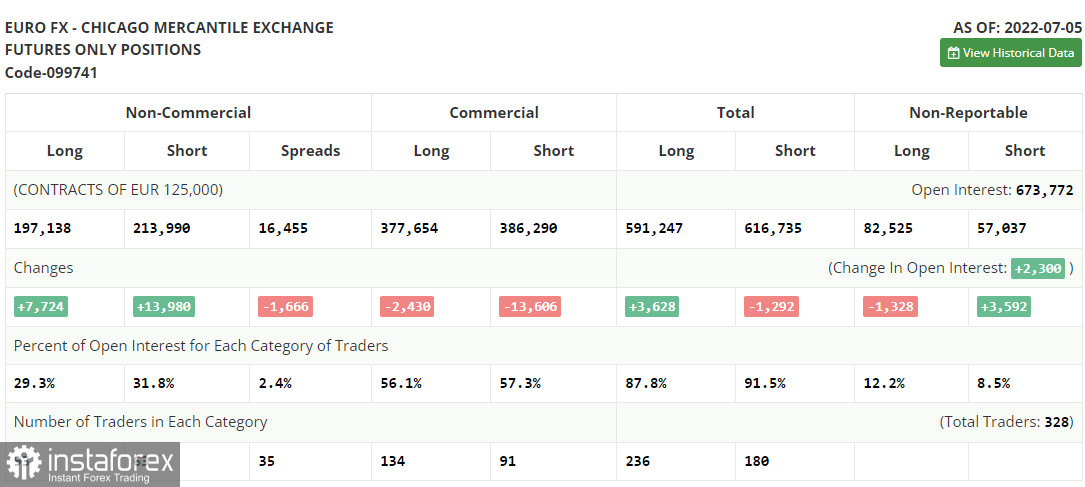
The Commitment of Traders (COT) report for July 5 logged an increase in both long and short positions, but the latter turned out to be almost twice as large, which indicates that the bearish mood in the market remains. This resulted in forming a larger negative delta. Eurozone retail sales disappointed last week, while US labor market data, on the contrary, pointed to the need to continue to maintain the over-aggressive monetary policy by the Federal Reserve if they are serious about fighting high inflation. European Central Bank President Christine Lagarde also spoke and talked a lot about the need to start raising interest rates all with the same goal. A rather important inflation report in the US is expected in the near future, which may once again point to another jump in price growth. If this happens, you will not be surprised at the dollar's further growth against the euro and the achievement of parity for this instrument. The COT report found that long non-commercial positions rose 7,724 to 197,138, while short non-commercial positions rose 13,980 to 213,990. In many developed countries - all this continues to push for long positions on the dollar. At the end of the week, the total non-commercial net position remained negative and amounted to -16,852 against -10,596. The weekly closing price dropped and amounted to 1.0316 against 1.0584.

Indicator signals:
Moving averages
Trading is below the 30 and 50-day moving averages, which indicates further decline in the pair.
Note: The period and prices of moving averages are considered by the author on the H1 hourly chart and differs from the general definition of the classic daily moving averages on the daily D1 chart.
Bollinger Bands
In case of a decline, the lower border of the indicator around 1.0010 will act as support. In case of growth, the upper border of the indicator in the area of 1.0060 will act as resistance.
Description of indicators
- Moving average (moving average, determines the current trend by smoothing out volatility and noise). Period 50. It is marked in yellow on the chart.
- Moving average (moving average, determines the current trend by smoothing out volatility and noise). Period 30. It is marked in green on the chart.
- MACD indicator (Moving Average Convergence/Divergence — convergence/divergence of moving averages) Quick EMA period 12. Slow EMA period to 26. SMA period 9
- Bollinger Bands (Bollinger Bands). Period 20
- Non-commercial speculative traders, such as individual traders, hedge funds, and large institutions that use the futures market for speculative purposes and meet certain requirements.
- Long non-commercial positions represent the total long open position of non-commercial traders.
- Short non-commercial positions represent the total short open position of non-commercial traders.
- Total non-commercial net position is the difference between short and long positions of non-commercial traders.
 English
 Русский
 Bahasa Indonesia
 Bahasa Malay
 ไทย
ไทย Español
 Deutsch
 Български
 Français
 Tiếng Việt
 中文
中文 বাংলা
বাংলা हिन्दी
 Čeština
 Українська
 Română

