Crypto Industry News:
The Ethereum-based non-trust lending protocol Eurler Finance faced a flash loan attack where the attacker managed to steal nearly $200 million in various cryptocurrencies.
According to data on the chain, according to the last update, the attacker has carried out many transactions, stealing almost 196 million dollars. The ongoing attack has already become the biggest hack of 2023.
According to the crypto-analytical company Meta Seluth, the attack correlates with the deflationary attack from a month ago. The hacker used a multi-chain bridge to transfer funds from BNB Smart Chain (BSC) to Ethereum and launched the attack today.
ZachXBT, another prominent on-chain detective, added that the flow of funds and the nature of the attack seems quite similar to the black hats that used the BSC-based protocol last month. After using the protocol in BSC, the funds were deposited in the Tornado Cash cryptocurrency mixer.
Euler Finance admitted to the hack and said it is currently working with security specialists and law enforcement to resolve the issue.
Technical Market Outlook:
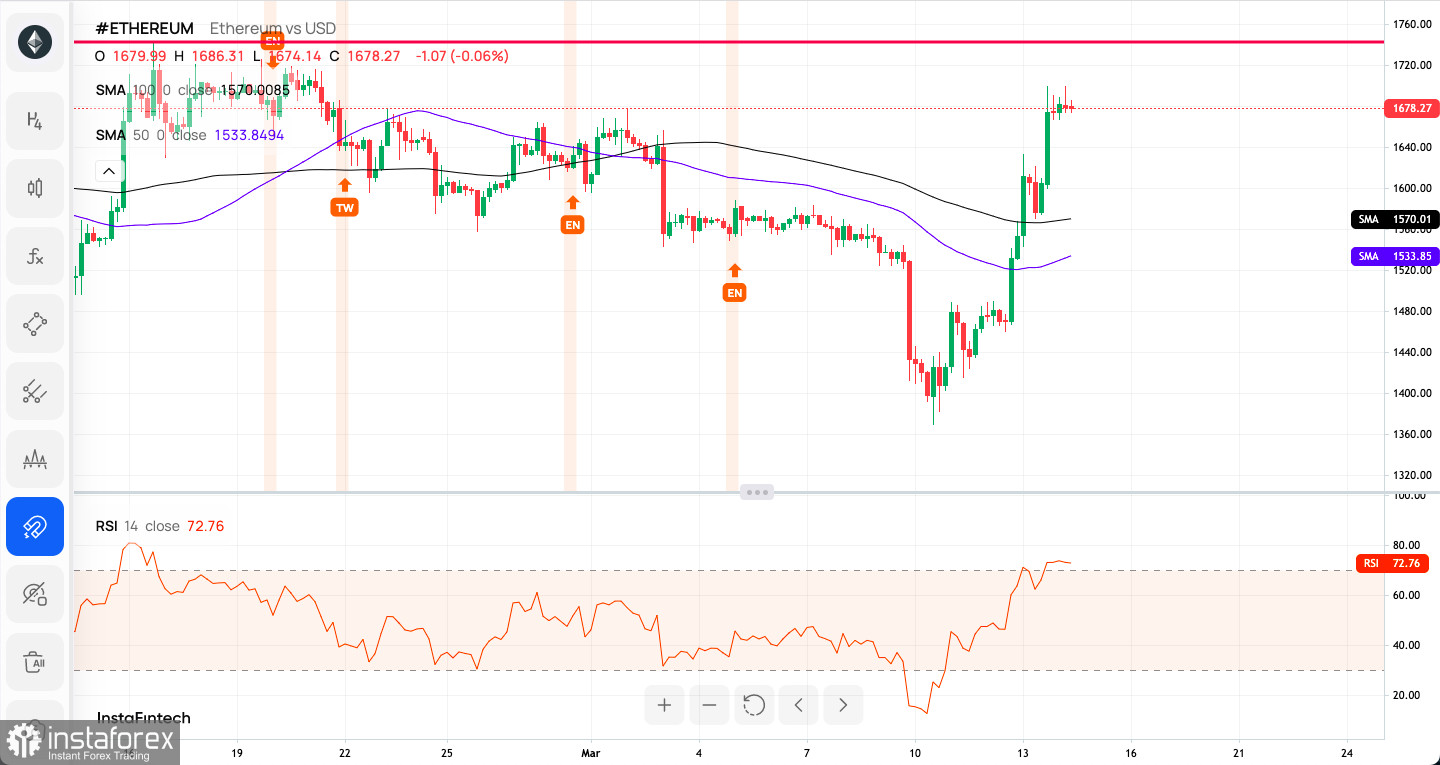
The ETH/USD pair had bounced from the level of $1,369, located just above the key short-term technical support and is currently approaching the monthly highs seen at the level of $1,742. The last daily candle close was above the 50 DMA, so this is a very bullish indication. The intraday technical support comes with the help of 50 MA seen at $1,619 and 100 MA seen at $1,644. The positive momentum on the daily time frame chart supports the short-term bullish bias for ETH.

Weekly Pivot Points:
WR3 - $1,709
WR2 - $1,656
WR1 - $1,629
Weekly Pivot - $1,603
WS1 - $1,575
WS2 - $1,550
WS3 - $1,497
Trading Outlook:
The Ethereum market has been seen making lower highs and lower low since the swing high was made in the middle of the August 2022 at the level of $2,029. The key technical support for bulls at $1,281 was broken already and the new swing low was established at $1,074. There is a clear test of the 50 WMA located at the level of $1,080, so any breakout below the moving average and a weekly candle close below moving average will be considered as another indication of the down trend continuation. If the down move will be extended, then the next target for bears is located at the level of $1,000.
 English
 Русский
 Bahasa Indonesia
 Bahasa Malay
 ไทย
ไทย Español
 Deutsch
 Български
 Français
 Tiếng Việt
 中文
中文 বাংলা
বাংলা हिन्दी
 Čeština
 Українська
 Română

