USD (#USD):

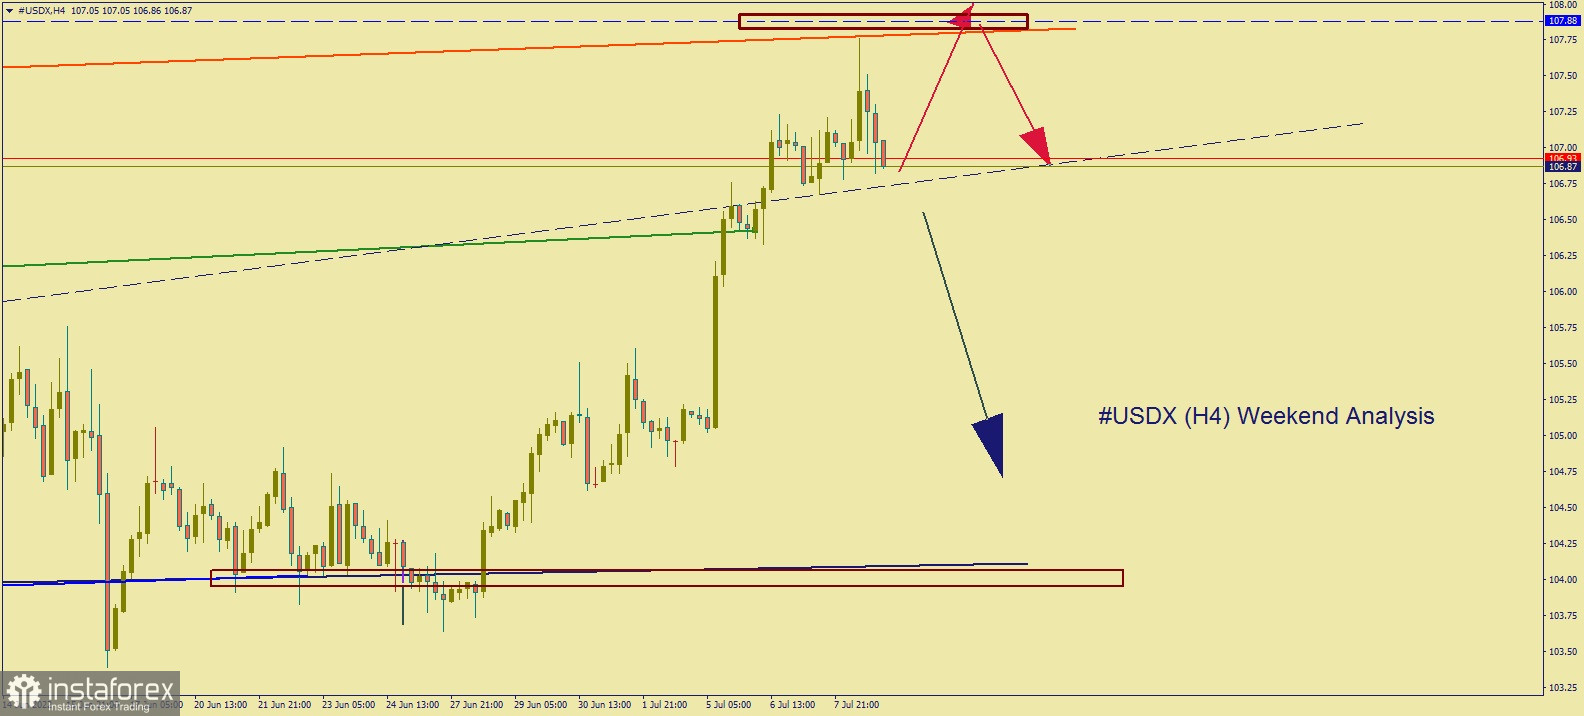
The graph shows the movement of USD in the 4-hour (H4) chart.
Last Friday (07/08/2022), #USD hit a record high of 107.80, its highest value in over 20 years.
This made the resistance area of 107.80-107.90 a key level of the trend, where a repeated test and breakout will lead to a rise to 110.00-111.00.
Meanwhile, a rebound from 107.80 could trigger two scenarios:
First is a breakdown of 106.50 and further downward movement to 104.00.
The second is a rebound from the support area of 106.70-106.80 to the key resistance level of 107.80.
Platinum (#PLF):

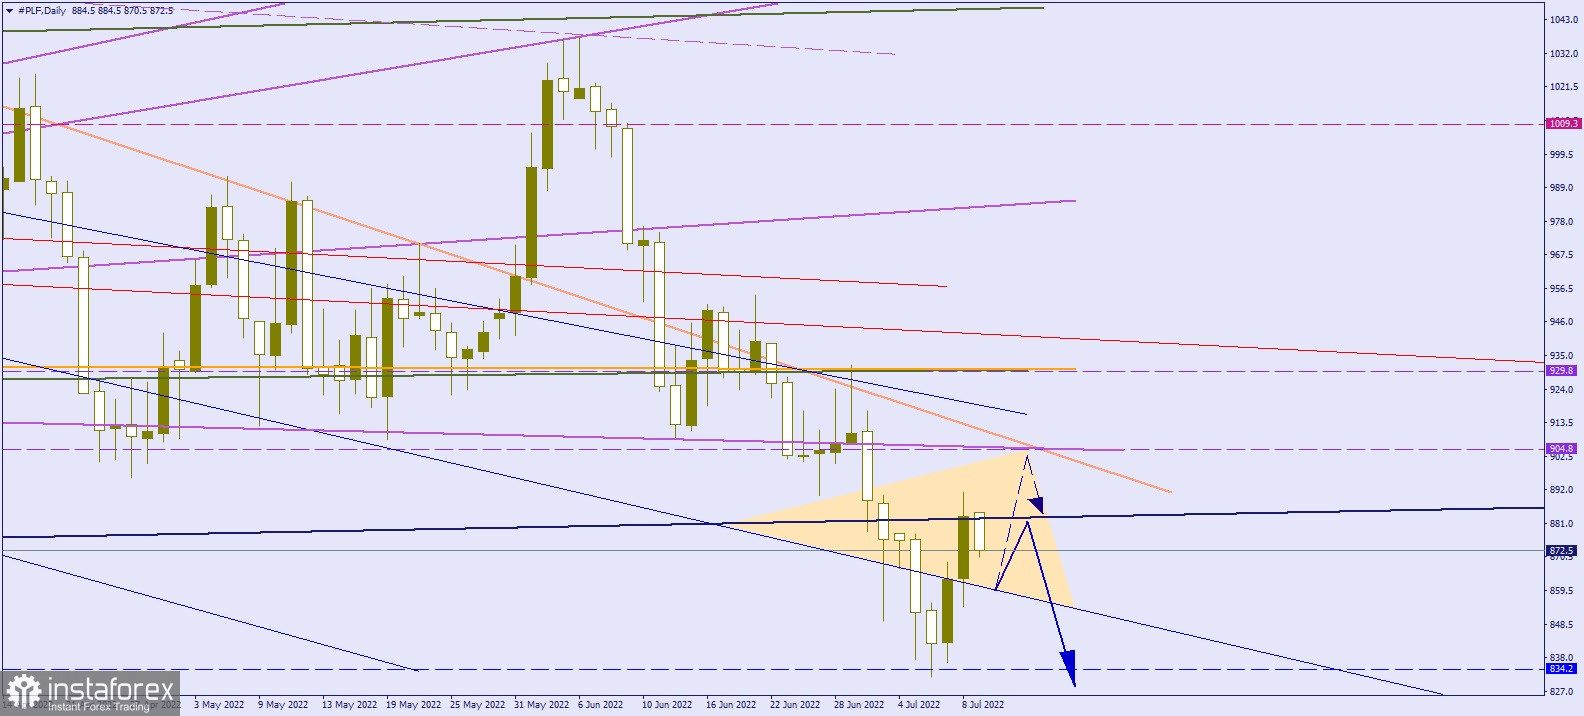
The chart shows the movement of platinum in the daily (D1) chart.
In the next 2-3 days, #PLF quotes will most likely be consolidated inside the marked triangle.
The upper top will be $904.8, which is located in the divergence zone.
The resistance level of $883.5, paired with the indicated top, will determine the price dynamics of platinum.
 English
 Русский
 Bahasa Indonesia
 Bahasa Malay
 ไทย
ไทย Español
 Deutsch
 Български
 Français
 Tiếng Việt
 中文
中文 বাংলা
বাংলা हिन्दी
 Čeština
 Українська
 Română

