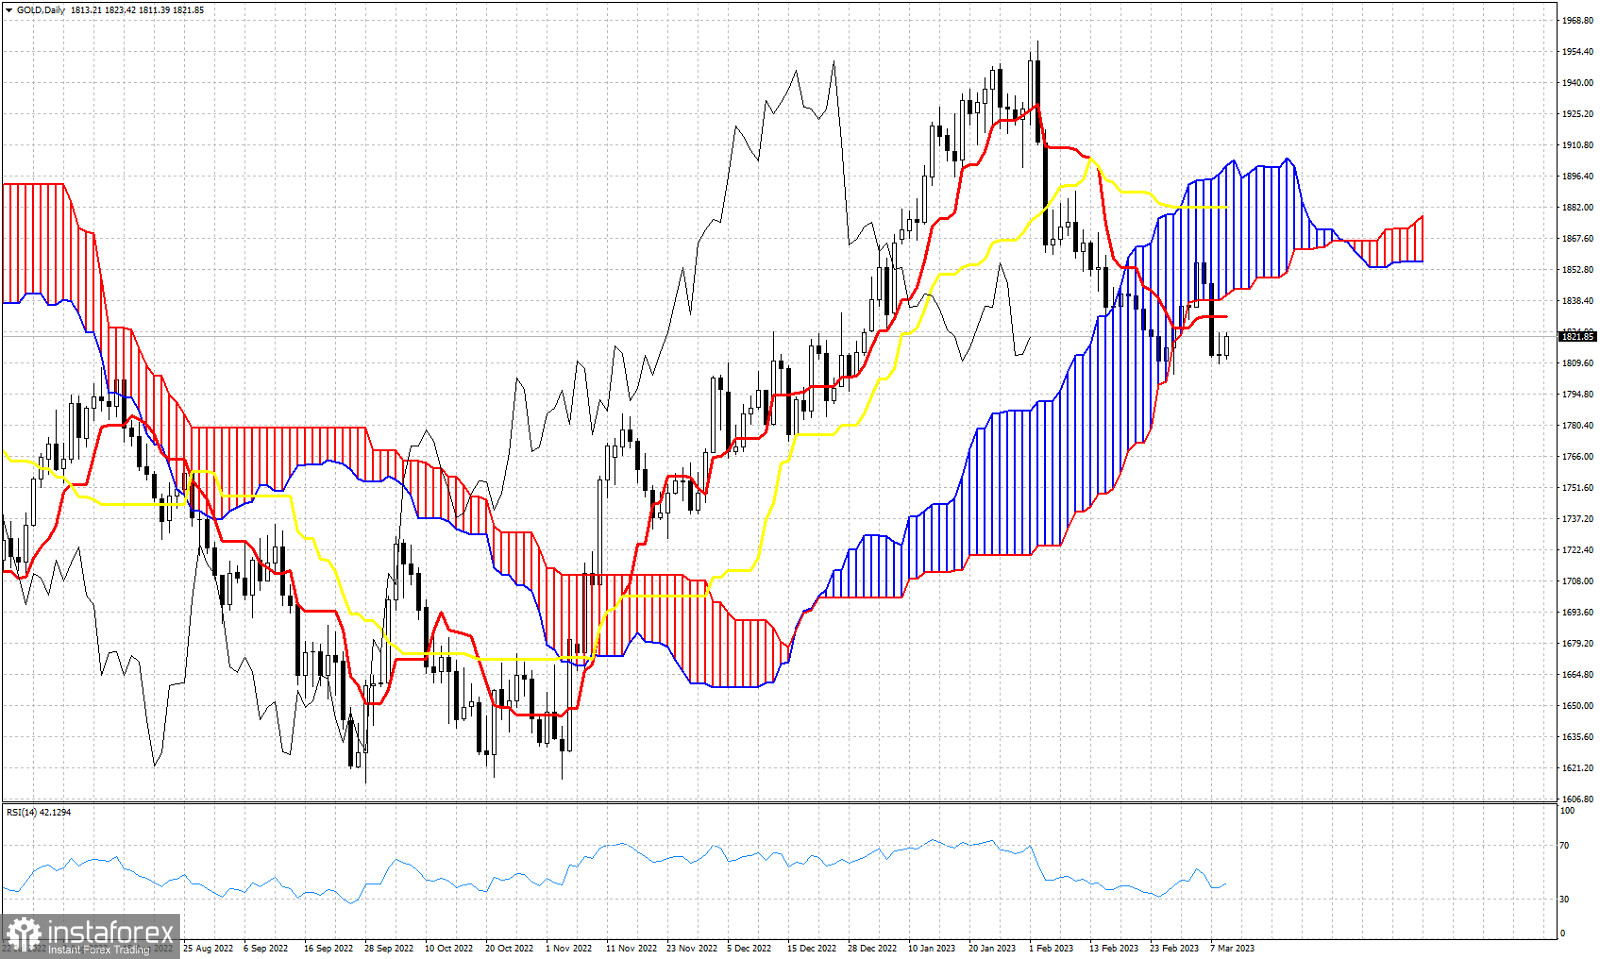
Gold price is bouncing towards $1,825. What was once support is now resistance. In the 4hour chart price is testing the Kumo (cloud) from below. Short-term trend remains bearish according to the Ichimoku cloud indicator. Also in the Daily chart we have a new bearish signal when price broke down below the Kumo. The tenkan-sen (red line indicator) provides resistance at $1,831 while the lower cloud boundary is at $1,841. As long as price is below the Kumo, Gold will be vulnerable to more downside. If bulls manage to recapture $1,841, then we could see another attempt towards $1,900. Bulls do not want to see price get rejected after a test of the cloud. Support at $1,804 remains very important. A break below this level will confirm the bearish signal that we got.with the cloud breakdown.
 English
 Русский
 Bahasa Indonesia
 Bahasa Malay
 ไทย
ไทย Español
 Deutsch
 Български
 Français
 Tiếng Việt
 中文
中文 বাংলা
বাংলা हिन्दी
 Čeština
 Українська
 Română

