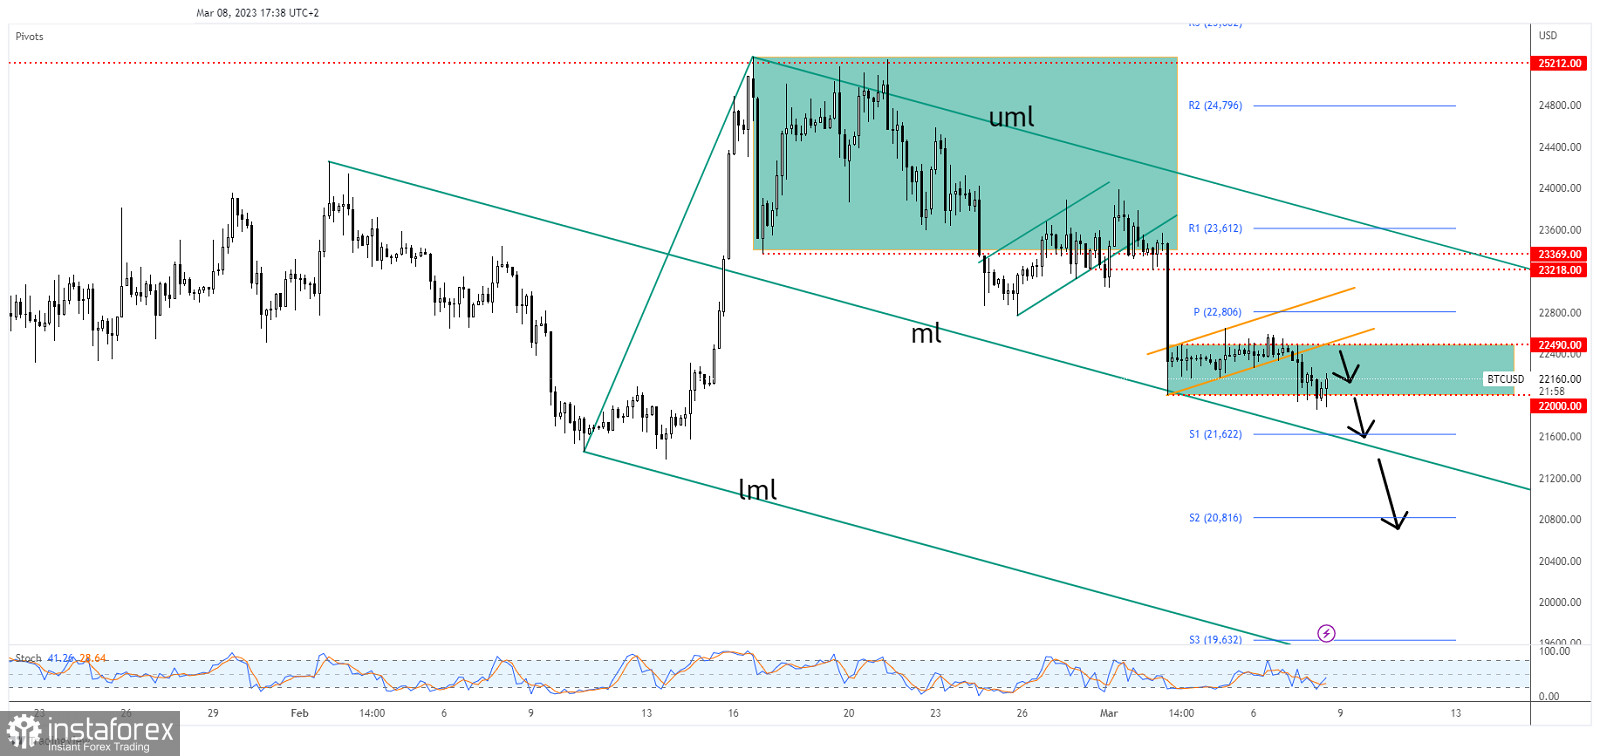
The price of Bitcoin is moving sideways in the short term. It's trading at 22,148 at the time of writing and is fighting hard to rebound. Still, the downside pressure remains high, so a deeper drop is favored.
BTC/USD is down by 0.88% in the last 24 hours and by 6.64% in the last 7 days. Bitcoin's deeper drop should force the altcoins to drop as well. The bias is bearish in the short term, temporary rebounds could bring us new selling opportunities.
BTC/USD Paused By 22,000!

BTC/USD is trapped between 22,000 and 22,490 levels in the short term. After testing and retesting the range's resistance and registering only false breakouts, the crypto broke below the flag's downside line and signaled more declines.
Now, it has stopped by the 22,000 psychological level, so it could try to come back to test and retest the broken uptrend line.
BTC/USD Outlook!
Escaping from the current range could bring us new opportunities. A valid breakdown below 22,000 activates more declines at least towards the median line (ml) and down to the S1 (21,622). A larger downside movement should be activated by a valid breakdown below the median line (ml).
 English
 Русский
 Bahasa Indonesia
 Bahasa Malay
 ไทย
ไทย Español
 Deutsch
 Български
 Français
 Tiếng Việt
 中文
中文 বাংলা
বাংলা हिन्दी
 Čeština
 Українська
 Română

