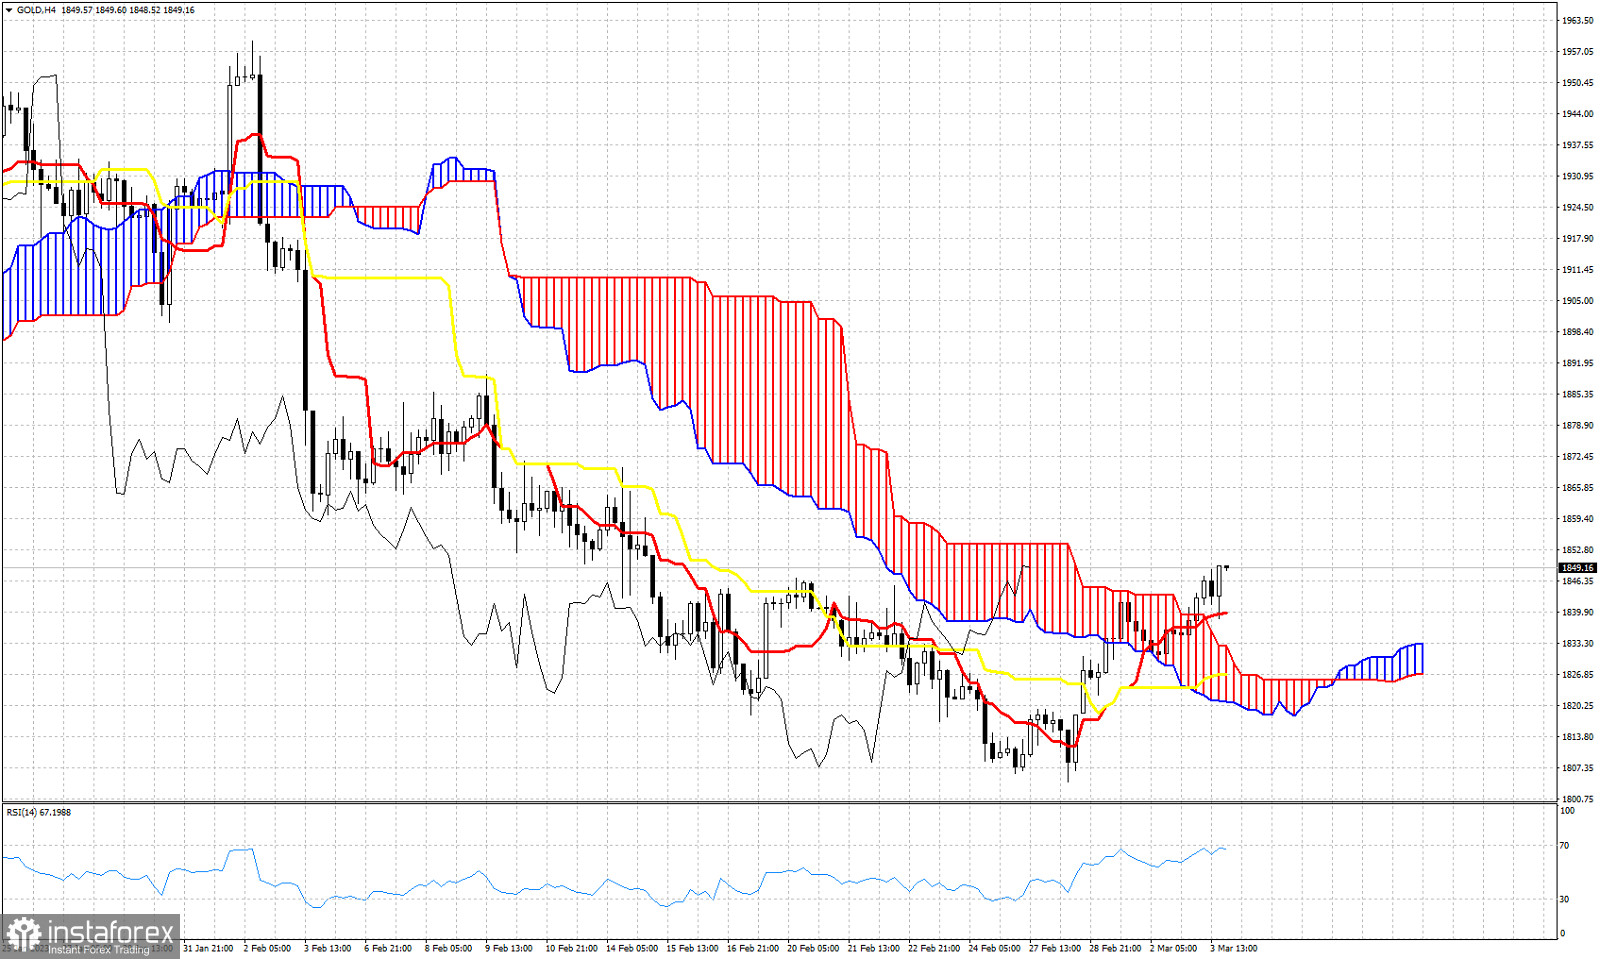
Gold price is trading above $1,840 and today has provide us with a new bullish signal in the 4 hour chart as price has broken above the Kumo (cloud). The 4 hour chart turns bullish according to the Ichimoku cloud indicator. Price is above both the tenkan-sen (red line indicator) and the kijun-sen (yellow line indicator). The tenkan-sen is above the kijun-sen. The Chikou span (black line indicator) is above the candlestick pattern and is very close to breaking above the cloud as well. Support is at $1,841 and at $1,828. Bulls need to defend these two levels. Resistance is at $1,854. We might see a pull back towards the Kumo as a back test of the break out. It is not necessary to see a back test. Concluding the most important change this week is the trend change to bullish in the 4 hour chart according to the Ichimoku cloud indicator. Will bulls be able to maintain control of the short-term trend?
 English
 Русский
 Bahasa Indonesia
 Bahasa Malay
 ไทย
ไทย Español
 Deutsch
 Български
 Français
 Tiếng Việt
 中文
中文 বাংলা
বাংলা हिन्दी
 Čeština
 Українська
 Română

