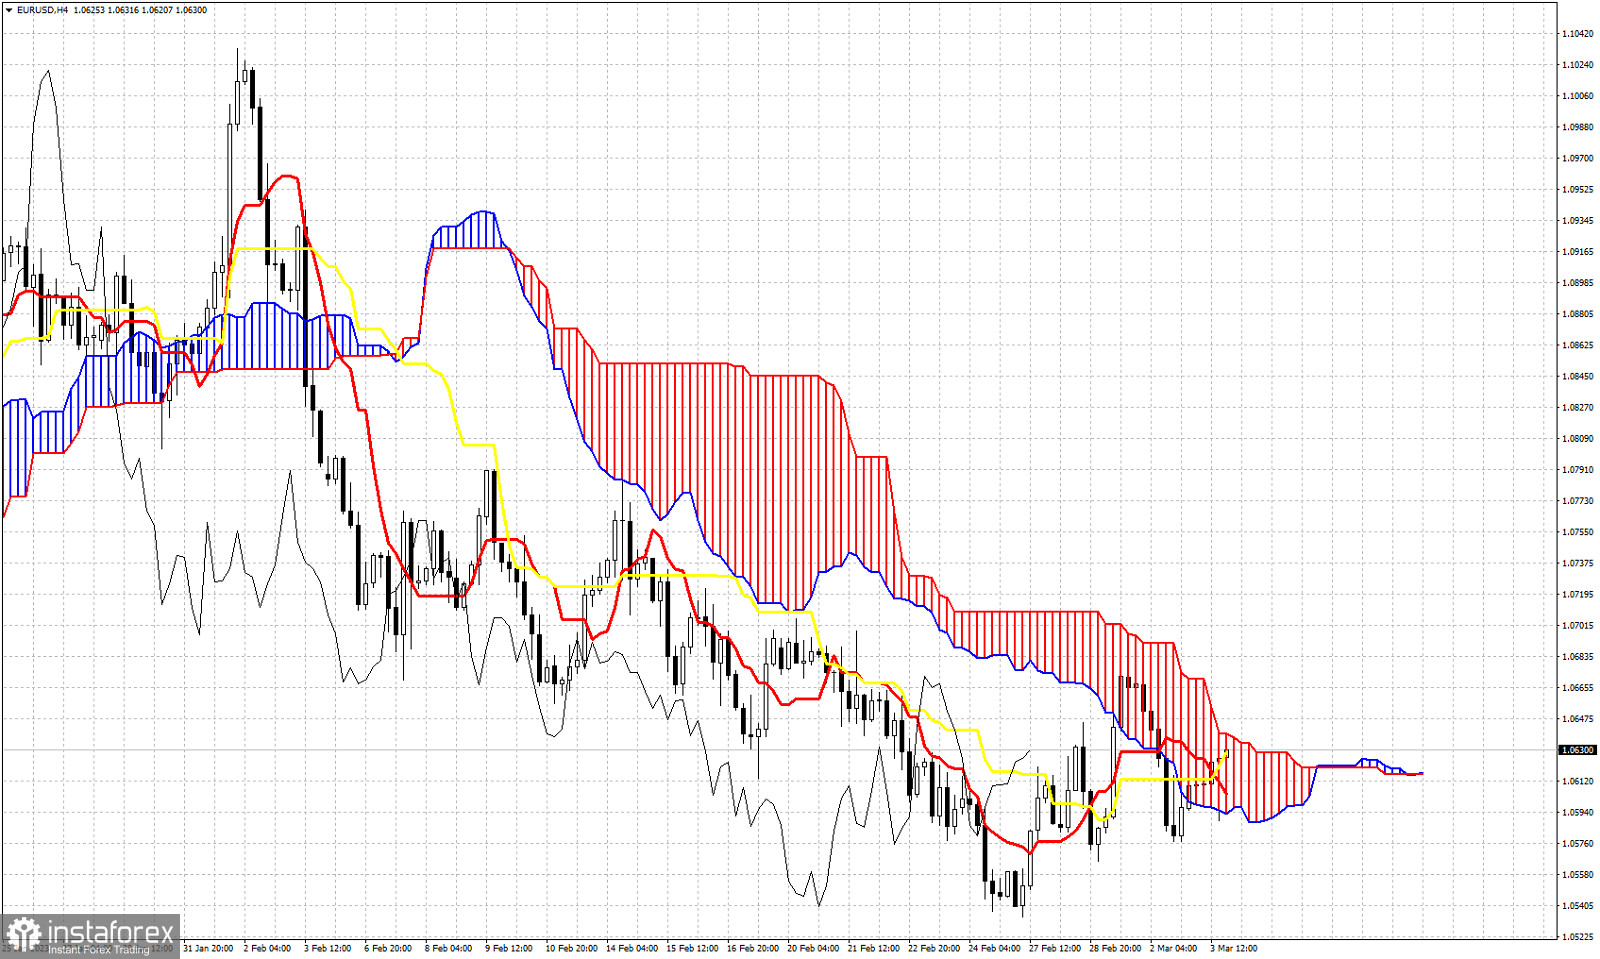
EURUSD is trading around 1.0630. Short-term trend has changed to neutral as price has entered the Kumo. There are increased chances that EURUSD trend will turn bullish. We use the Ichimoku cloud indicator to identify key support and resistance levels. Price is trading above the tenkan-sen (red line indicator) and the kijun-sen (yellow line indicator). Resistance by the upper cloud boundary is at 1.0640. Bulls need to recapture this level and stay above it in order to regain control of the short-term trend. The Chikou span (black line indicator) is above the candlestick pattern but below the Kumo. If bulls manage to break above the Kumo we will have a new bullish signal. If bulls manage to hold price above the Kumo and then see a cross of the tenkan-sen above the kijun-sen, we will get another bullish signal. Support by the tenkan-sen and kijun-sen indicators is at 1.0605 and 1.0628. The lower cloud boundary provides support at 1.0593. This is the last line of defense for bulls.
 English
 Русский
 Bahasa Indonesia
 Bahasa Malay
 ไทย
ไทย Español
 Deutsch
 Български
 Français
 Tiếng Việt
 中文
中文 বাংলা
বাংলা हिन्दी
 Čeština
 Українська
 Română

