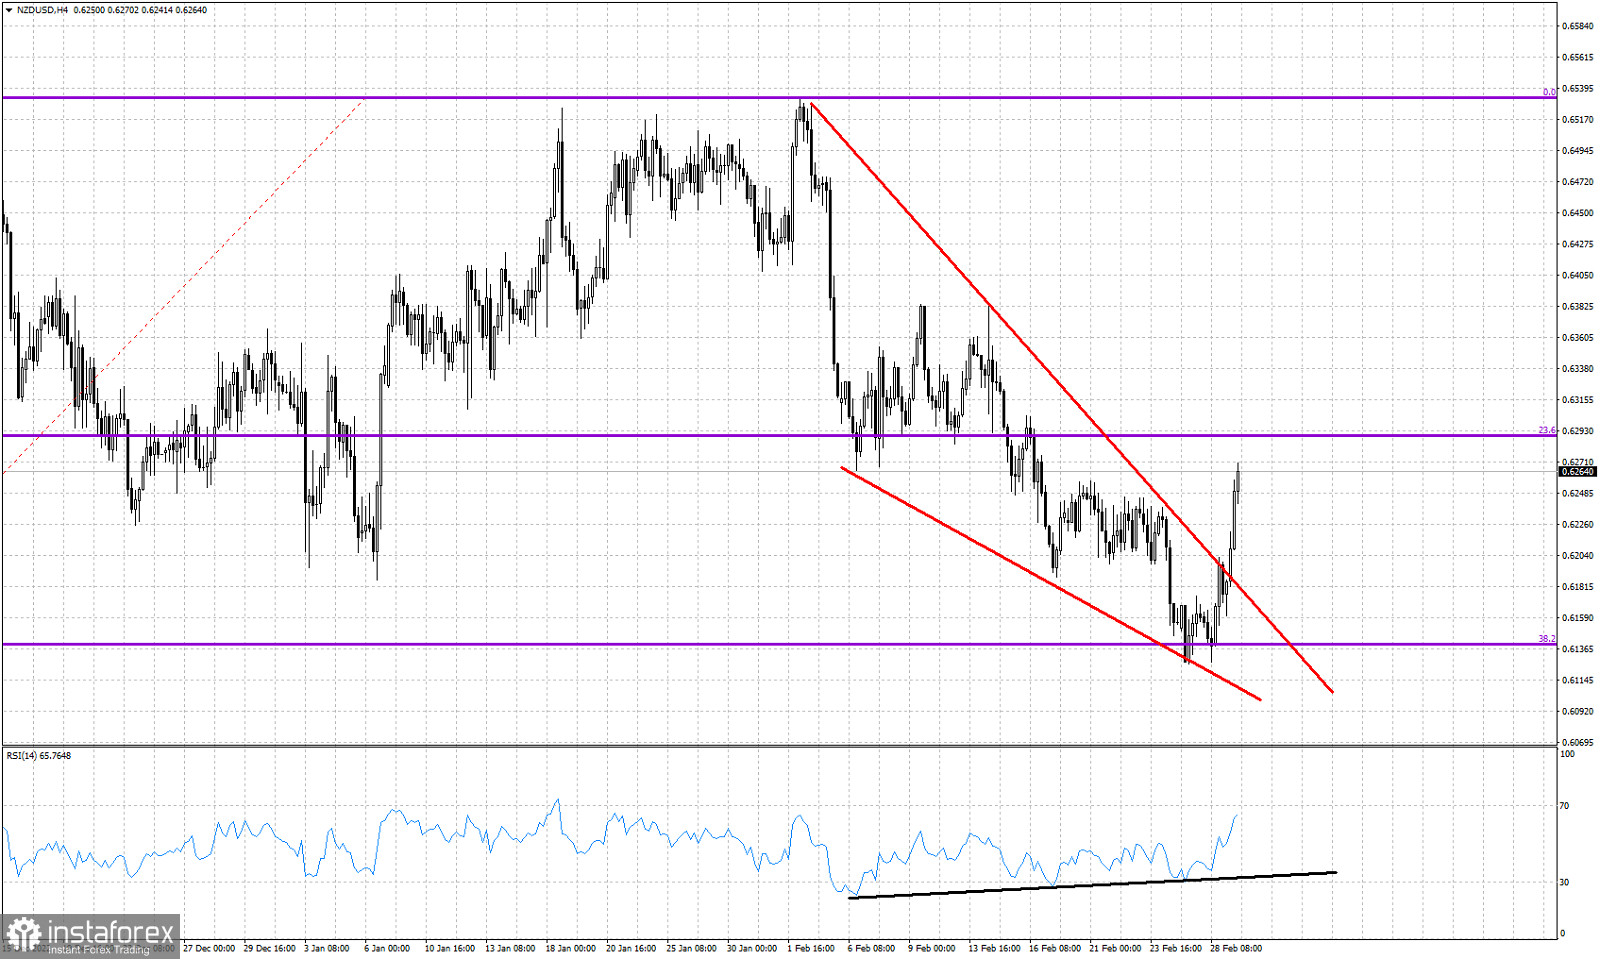
Red lines- wedge pattern
Black line- bullish RSI divergence
Violet lines- Fibonacci retracements
Aswe warned traders at the beginning of this week, NZDUSD was very probable to produce a bounce higher. Price had formed a downward sloping wedge pattern and the RSI was already providing bullish divergence signs. NZDUSD has retraced as low as the 38% retracement level and formed a low at that Fibonacci support. Price bounced off the lower wedge pattern boundary and then broke above the upper boundary. Short-term resistance was broken and price has now bounced towards 0.6250.
 English
 Русский
 Bahasa Indonesia
 Bahasa Malay
 ไทย
ไทย Español
 Deutsch
 Български
 Français
 Tiếng Việt
 中文
中文 বাংলা
বাংলা हिन्दी
 Čeština
 Українська
 Română

