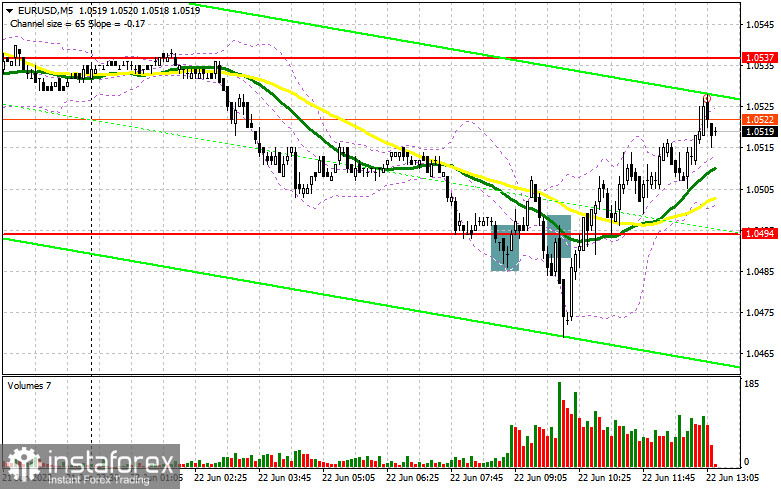
In my forecast this morning, I drew your attention to the level of 1.0494 and recommended entering the market from it. Let's have a look at the 5-minute chart and analyze what happened. The false breakout in the morning led to the buy signal, but after the increase of 15 pips, the pressure on the euro returned, which returned the pair to the breakeven level. The breakthrough and the retest of 1.0494 was an excellent sell signal ahead of the Fed meeting, but the pair declined by about 25 pips. After that, bulls managed to take the pair back to 1.0494, aiming at the daily highs.

Long positions on EUR/USD:
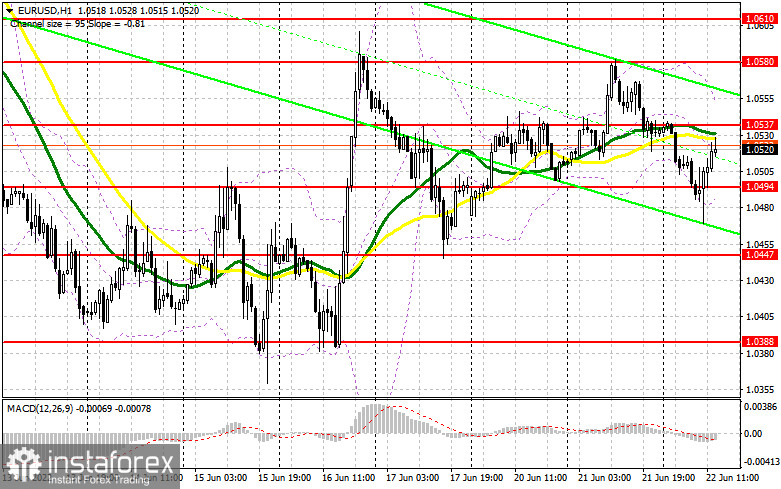
As I noted earlier today, everything depends on what Fed Chairman Jerome Powell has to say today. It seems that the market is paying too much attention to Powell's speech as he is unlikely to say something new. Everyone is expecting further rate hikes of 0.75% at the next meeting in July, as well as fighting inflation and a more aggressive rollback of soft policies. This is already priced in the US dollar. If Powell repeats what he said after the Fed meeting last week in Congress today, the euro may strengthen because we have the first interest rate hike from the European Central Bank ahead. It is a more significant event for the market since the regulator has kept the rates near zero for a decade. If the euro declines, bulls may have all chances to protect the nearest support at 1.0494 that was formed during the morning trading. A false breakout at this level can create a signal to open long positions, expecting further growth to new intraday highs and touching 1.0537, where the moving averages are passing, supporting bears. A breakthrough and a top/bottom test of this level are likely to trigger sellers' Stop Loss orders, which will give a signal to open long positions with the target at 1.0580, where traders may lock in profits. If the EUR/USD pair declines and bulls show weak activity at 1.0494, the pressure on the euro is likely to increase. This may lead to new problems for buyers. In that case, I would not recommend entering the market at that moment. It would be better to open long positions after a false breakout near support of 1.0447. It is also better to buy the EUR/USD pair on a pullback only from 1.0388, or lower near 1.0321, allowing an upward intraday correction of 30-35 pips.
Short positions on EUR/USD:
Bears showed some activity in the market and even tried to quickly take control of it. However, all this led only to the sales during the Asian session, after which the pressure on the euro eased. If the EUR/USD pair rises in the afternoon after the US data release, only a false breakout at 1.0537, which is almost today's high, may generate a signal to open short positions aiming at new support of 1.0494, formed in the first half of the day. A lot depends on this level because if bulls manage to keep the price above this level, the lower boundary of a new ascending channel can be placed there, which may open good prospects for further growth of the euro. A breakthrough and a consolidation below this level with strong US data and unexpected comments from Powell, as well as a retest of 1.0494 from below, may trigger an additional sell signal hitting buyers' Stop Loss orders and a larger decrease to the area of 1.0447. A breakthrough and consolidation below 1.0447 may open a way to 1.0388, where trades may close their short positions. In the case of an upward movement of the EUR/USD pair during the US session, and a lack of activity from bears at 1.0537, it would be better to postpone the opening of short positions until the pair reaches a more attractive level of 1.0580. A false breakout at this level may trigger a new downward correction in the pair. You can also sell the euro on a rebound from the high of 1.0610, or higher near 1.0640, allowing a downward correction of 30-35 pips.

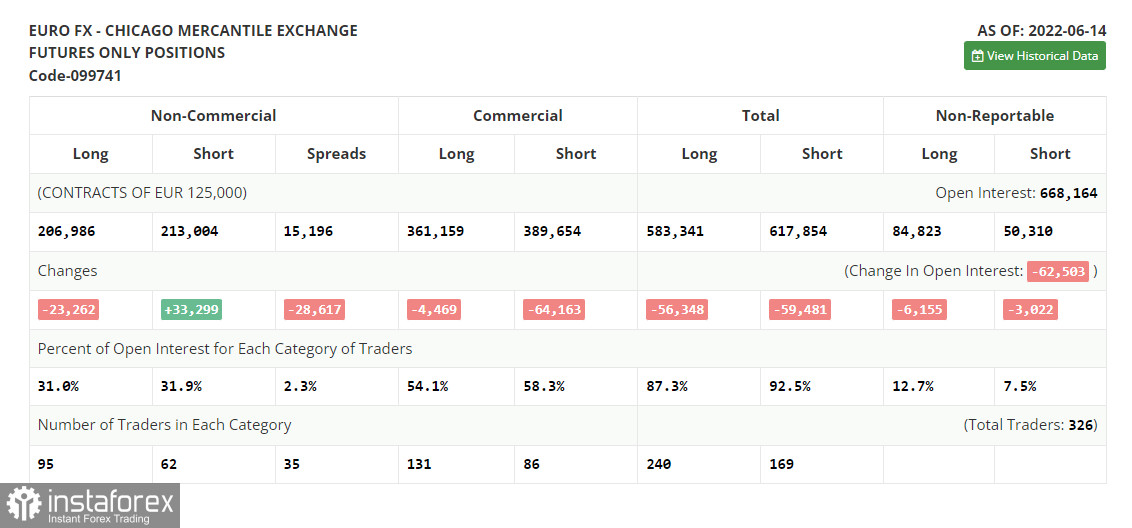
The COT report for June 14 logged a sharp reduction in long positions and growth in short positions, which led to the formation of a negative delta, indicating a bearish sentiment. The ECB meeting was held and all the emphasis was on the Federal Reserve's decision, which raised interest rates by 0.75% at once, claiming a continued curbing of inflation in the US. The fact that policymakers continue to pursue tight monetary policy makes traders get rid of risky assets and buy the US dollar, which leads to its strengthening. This trend is likely to continue, as no one is going to give up on measures to fight inflation by raising interest rates. The COT report showed that long non-commercial positions shrank by 23,262 to 206,986, while short non-commercial positions jumped by 33,299 to 213,004. Despite the euro being cheap, this does not make it attractive, as traders are opting for the US dollar. At the end of the week, the total non-commercial net position turned negative and decreased to -6,018 from 50,543. The weekly closing price fell to 1.0481 from 1.0710.

Indicator signals:
Moving averages
The pair is trading below the 30- and 50-day moving averages, indicating bears' attempt to take control over the market.
Note: The period and prices of moving averages are considered by the author on hourly chart H1 and differ from the general definition of classic daily moving averages on daily chart D1.
Bollinger Bands
If the pair declines, the lower boundary of the indicator in the area of 1.0485 will act as support. If the pair grows, the level of 1.0560 will act as resistance.
Indicators description
- Moving average defines the current trend by smoothing out volatility and noise. Period 50. Marked in yellow on the chart.
- Moving average defines the current trend by smoothing out volatility and noise. Period 30. Marked in green on the chart.
- MACD (Moving Average Convergence/Divergence) indicator Fast EMA of period 12. Slow EMA period 26. SMA period 9
- Bollinger Bands. Period 20
- Non-commercial traders are speculators, such as individual traders, hedge funds, and large institutions, which use the futures market for speculative purposes and meet certain requirements.
- Long non-commercial positions represent the total long open position of non-commercial traders.
- Short non-commercial positions represent the total short open position of non-commercial traders.
- Total non-commercial net position is the difference between short and long positions of non-commercial traders.
 English
 Русский
 Bahasa Indonesia
 Bahasa Malay
 ไทย
ไทย Español
 Deutsch
 Български
 Français
 Tiếng Việt
 中文
中文 বাংলা
বাংলা हिन्दी
 Čeština
 Українська
 Română

