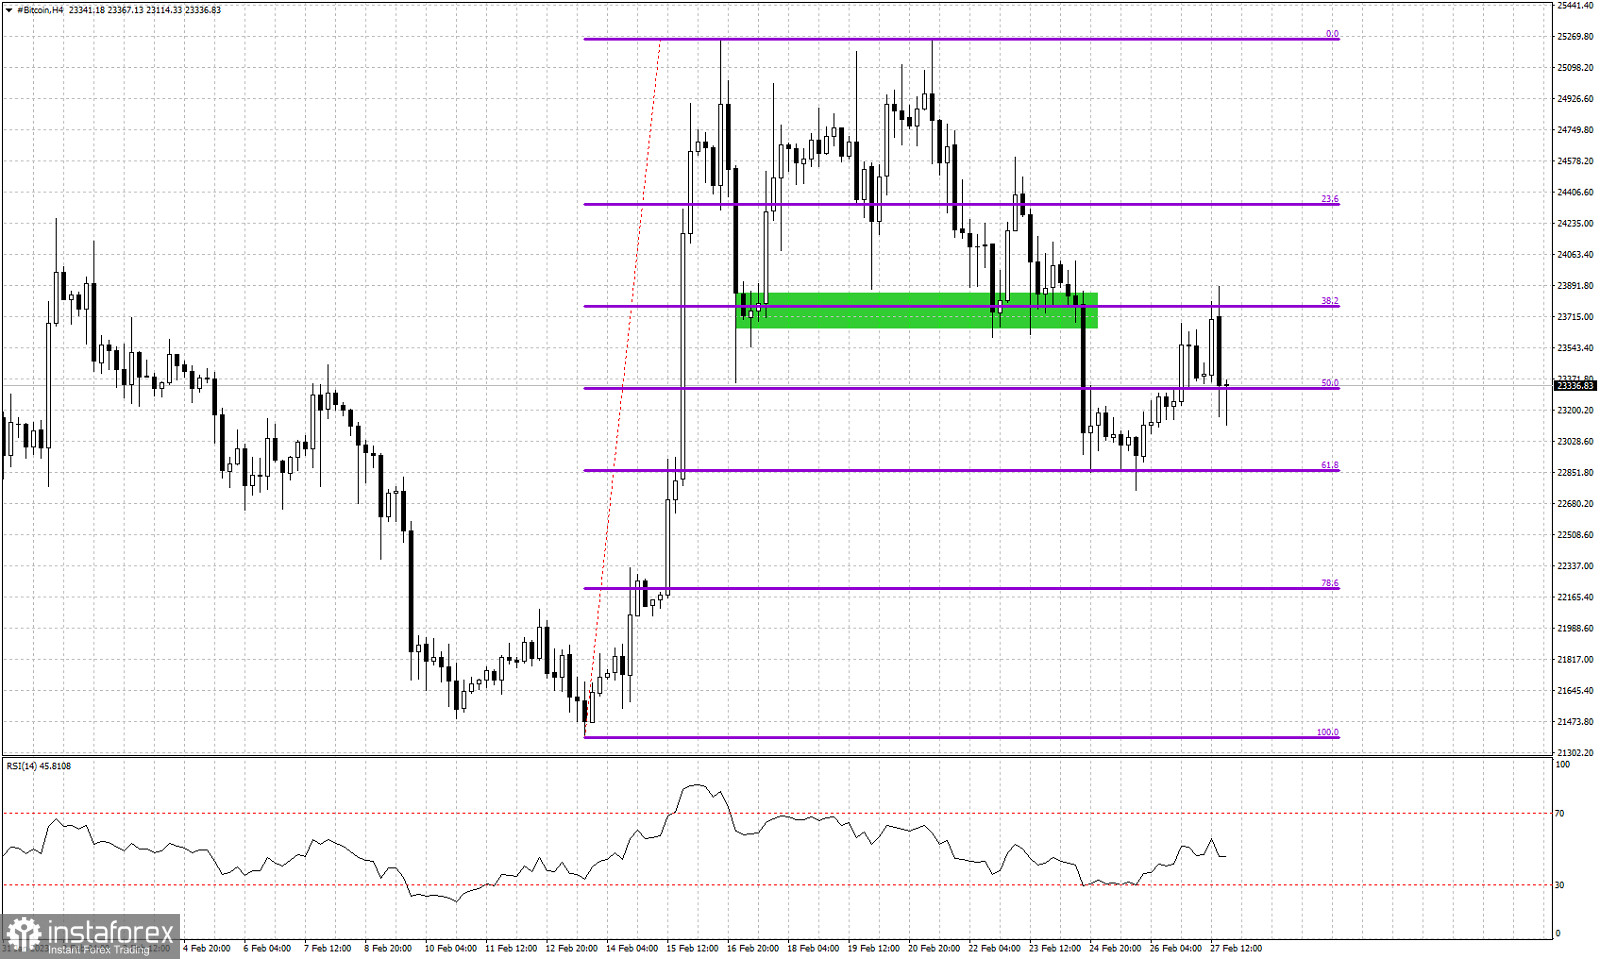
Violet lines- Fibonacci retracements
Green rectangle- horizontal support (broken)
Bitcoin is trading around $23,300. Price recently broke below the horizontal support around $23,700 and formed a higher low at the 61.8% Fibonacci retracement of the latest upward move. Forming a higher low is a positive sign for bulls. Bulls now need to start seeing higher highs and higher lows and eventually price break above the key resistance and recent high at $25,250. The broken support at $23,300 is now resistance. Bulls need to break above this level and start forming higher highs and higher lows. Bulls will need to defend the 61.8% Fibonacci retracement at $22,850. Failure to do so will open the way for a move towards $22,200 to $21,400.
 English
 Русский
 Bahasa Indonesia
 Bahasa Malay
 ไทย
ไทย Español
 Deutsch
 Български
 Français
 Tiếng Việt
 中文
中文 বাংলা
বাংলা हिन्दी
 Čeština
 Українська
 Română

