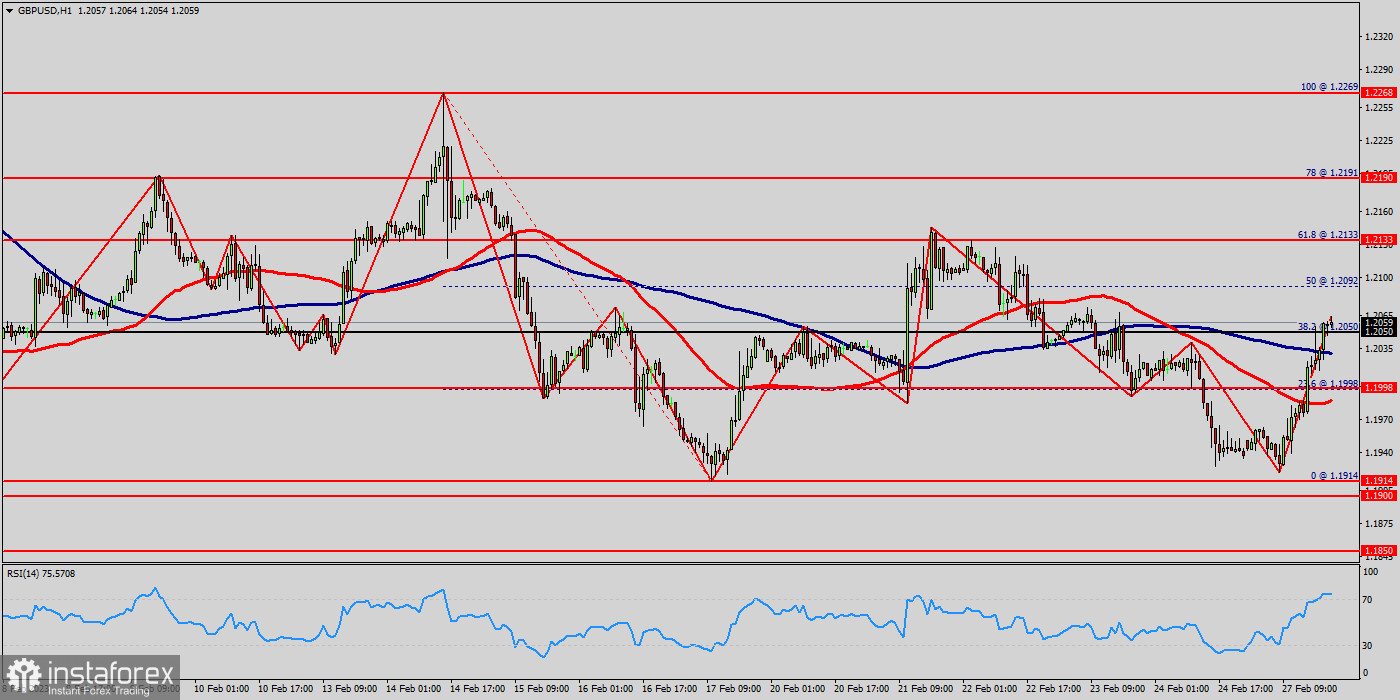
The GBP/USD pair set above strong support at the level of 1.1998, which coincides with the 23.6% Fibonacci retracement level. This support has been rejected for four times confirming uptrend veracity.
Hence, major support is seen at the level of 1.1998 because the trend is still showing strength above it.
Accordingly, the pair is still in the uptrend from the area of 1.1998 and 1.0200. The GBP/USD pair is trading in a bullish trend from the last support line of 1.1998 towards the first resistance level at 1.2133 in order to test it.
This is confirmed by the RSI indicator signaling that we are still in the bullish trending market.
Now, the pair is likely to begin an ascending movement to the point of 1.2133 and further to the level of 1.2190.
The level of 1.2190 will act as second resistance and the double top is already set at the point of 1.2268.
At the same time, if a breakout happens at the support levels of 1.1914 and 1.1900, then this scenario may be invalidated. But in overall, we still prefer the bullish scenario.
 English
 Русский
 Bahasa Indonesia
 Bahasa Malay
 ไทย
ไทย Español
 Deutsch
 Български
 Français
 Tiếng Việt
 中文
中文 বাংলা
বাংলা हिन्दी
 Čeština
 Українська
 Română

