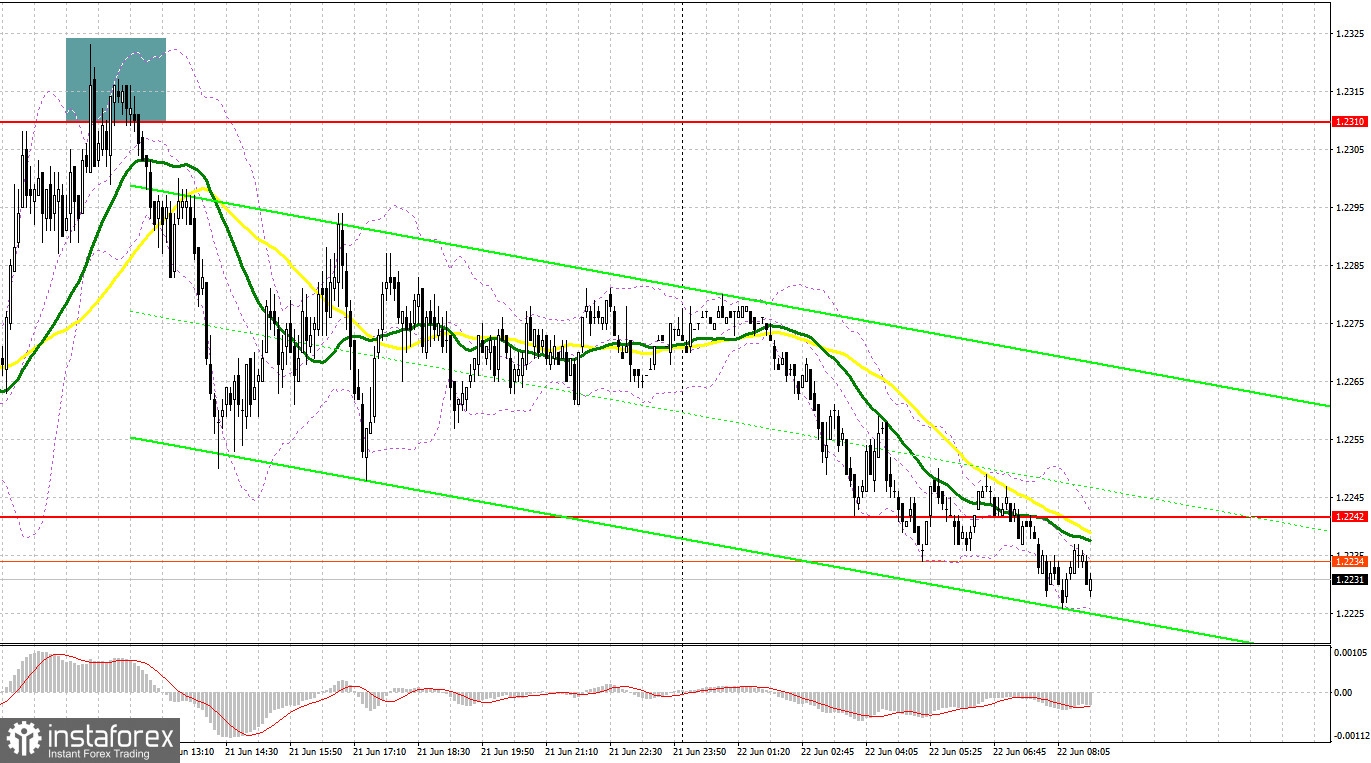
Yesterday a single signal was formed to enter the market in the first half of the day. Let's take a look at the 5-minute chart and see what happened. I paid attention to 1.2310 in my morning forecast and advised making decisions from it. Failure to rise above 1.2310 resulted in forming a false breakout, which in turn gave a signal to sell the pound. As a result, the pair went down more than 60 points, but failed to reach the nearest support at 1.2242. I planned to make decisions to buy the pound from this level.

When to go long on GBP/USD:
Data on inflation in the UK will be released today, but it is unlikely that even a significant jump in the consumer price index above economists' forecasts will somehow affect the pound, whose quotes already include inflation of 11.0% for the year - the official forecast of the Bank of England. If inflation suddenly falls, this will also not help the pound, since the higher the CPI, the more likely it is that the central bank will carry out a more aggressive policy and the more likely the demand for the British pound will return. In my opinion, the focus will shift in the afternoon and how Federal Reserve Chairman Jerome Powell will present himself before Congress. Most likely, he will talk about how serious he is about fighting inflation and that he will not allow a new rise in prices, which have already led to a recession in the economy. His aggressive tone could bring back demand for the US dollar, leading to a bigger sell-off in GBP/USD and likely the pair's return to yearly lows.
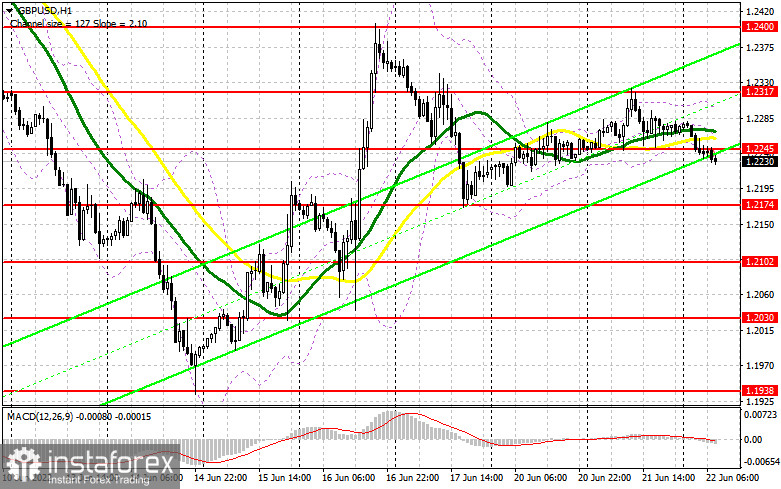
In case the pound is under pressure in the first half of the day, the bulls will have to try very hard to offer something around 1.2174. Therefore, forming a false breakout there will give a signal to open new long positions in anticipation of growth to the nearest level of 1.2245, which the bulls missed during the Asian session. This level is critical for the bulls, as regaining control of this level could mean that it will be possible to count on the resumption of the bull market formed on June 14th. There are also moving averages, playing on the bears' side. A breakthrough and downward test of 1.2245 will provide a buy signal in anticipation of an update at 1.2317 and then last week's high at 1.2400. A similar breakthrough of this level will lead to another entry point into long positions with the prospect of exiting at 1.2452, where I recommend taking profits.
A more distant target will be the 1.2484 area, but this scenario will be realized only in case of very dovish rhetoric from Powell. If the GBP/USD falls and there are no bulls at 1.2174, the pressure on the pair will increase. In this case, I advise you to open new long positions only on a false breakout from 1.2102. You can buy GBP/USD immediately on a rebound from 1.2030, or even lower - around 1.1938 with the goal of correcting 30-35 points within the day.
When to go short on GBP/USD:
The bears broke through the bottom of the short-term corrective channel after last Friday's sell-off, and now the market is waiting. It is very important not to let the bulls return to the area above 1.2245, where the moving averages also pass. Forming a false breakout there after the inflation data is released will result in creating an excellent sell signal with the prospect of a return to 1.2174 - an important level, a breakthrough of which will lead to a complete defeat of the bulls. Consolidating below 1.2174 and a reverse test from the bottom up will give an entry point into short positions with the prospect of a decline to 1.2102, where I recommend partially taking profits. A more distant target will be the area of 1.2030, where I recommend to completely exit the market.
In case GBP/USD grows and the bears are not active at 1.2245, it remains only to rely on Powell and the nearest resistance at 1.2317. A false breakout at this level would provide a good entry point for short positions in anticipation of a resumption of the downward trend. In case traders are not active at 1.2317, another upsurge may occur amid the removal of stop orders of speculative bears. In this case, I advise you to postpone short positions to 1.2400. But even there, I advise you to sell the pound only in case of a false breakout, as going beyond this range will increase the demand for GBP/USD. You can look at short positions immediately for a rebound from 1.2452, or even higher - from 1.2484, based on the pair's rebound down by 30-35 points within the day.

COT report:
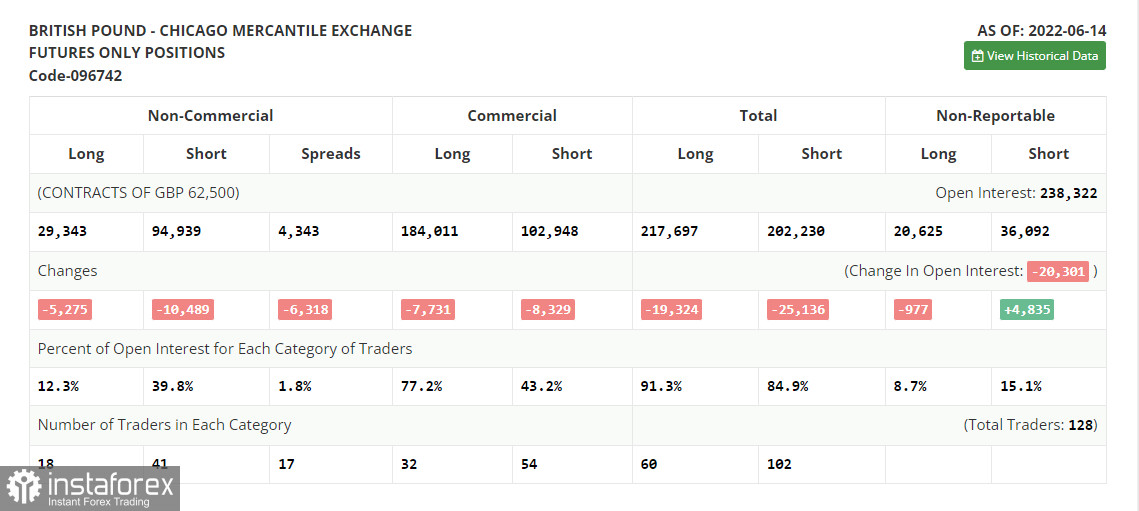
The Commitment of Traders (COT) report for June 14 logged a reduction in both long and short positions, which led to a slight decrease in the negative delta. After the Bank of England meeting, which announced the adherence to the previous plan to raise interest rates and fight high inflation, the pound strengthened its position, which will affect future COT reports. Surely the big players are taking advantage of the moment and buying back the heavily depreciated pound, despite all the negative that is happening to the UK economy right now. However, one should not count on the recovery of the pair in the near future, as the policy of the Federal Reserve will seriously help the US dollar in the fight against risky assets. The COT report indicated that long non-commercial positions decreased by 5,275 to 29,343, while short non-commercial positions decreased by 10,489 to 94,939. level -65,596. The weekly closing price decreased and amounted to 1.1991 against 1.2587.

I recommend to read:
Indicator signals:
Moving averages
Trading is below the 30 and 50-day moving averages, indicating an attempt by the bears to regain control of the market
Note: The period and prices of moving averages are considered by the author on the H1 hourly chart and differs from the general definition of the classic daily moving averages on the daily D1 chart.
Bollinger Bands
In case of growth, the area of 1.2300 will act as resistance.
Description of indicators
- Moving average (moving average, determines the current trend by smoothing out volatility and noise). Period 50. It is marked in yellow on the chart.
- Moving average (moving average, determines the current trend by smoothing out volatility and noise). Period 30. It is marked in green on the chart.
- MACD indicator (Moving Average Convergence/Divergence — convergence/divergence of moving averages) Quick EMA period 12. Slow EMA period to 26. SMA period 9
- Bollinger Bands (Bollinger Bands). Period 20
- Non-commercial speculative traders, such as individual traders, hedge funds, and large institutions that use the futures market for speculative purposes and meet certain requirements.
- Long non-commercial positions represent the total long open position of non-commercial traders.
- Short non-commercial positions represent the total short open position of non-commercial traders.
- Total non-commercial net position is the difference between short and long positions of non-commercial traders.
 English
 Русский
 Bahasa Indonesia
 Bahasa Malay
 ไทย
ไทย Español
 Deutsch
 Български
 Français
 Tiếng Việt
 中文
中文 বাংলা
বাংলা हिन्दी
 Čeština
 Українська
 Română

