EUR/USD 5M

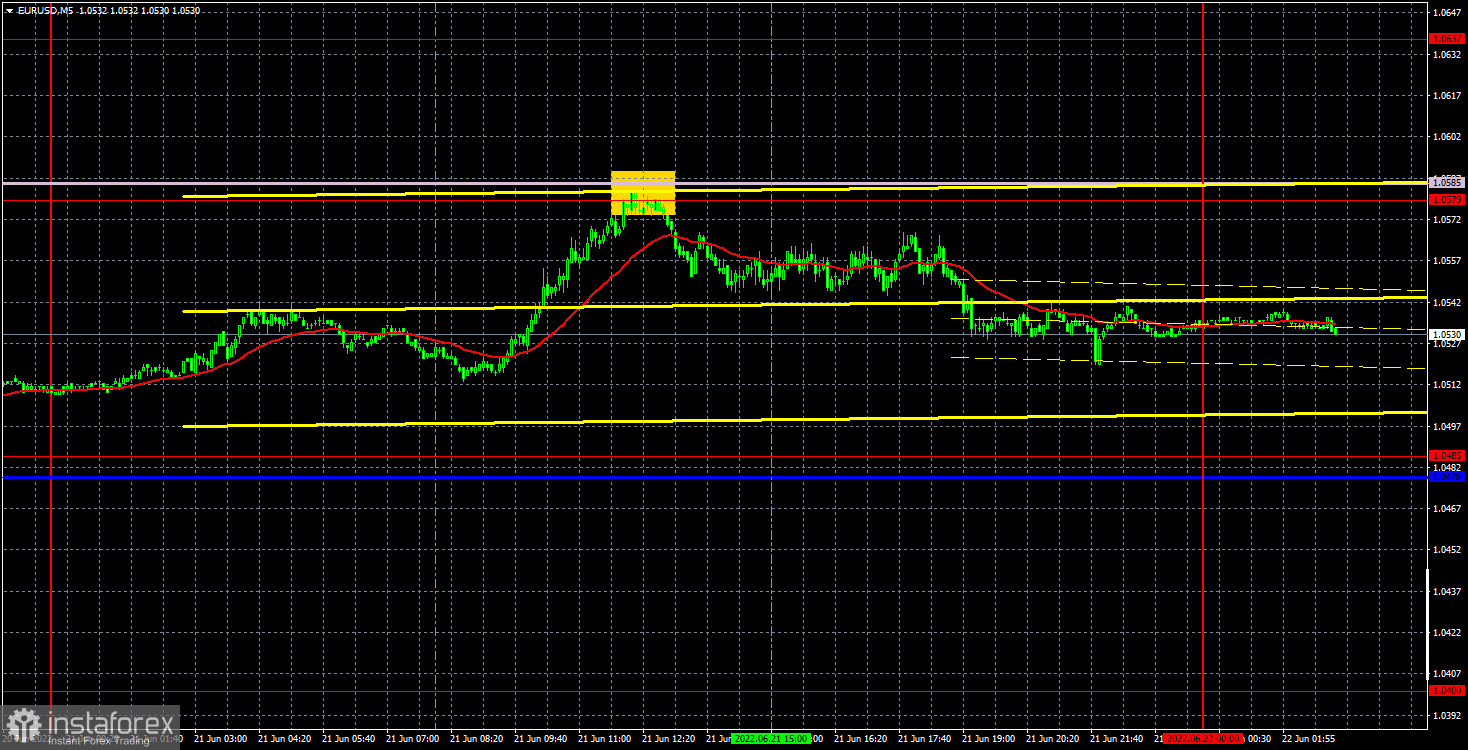
The EUR/USD pair did not show anything interesting on Tuesday. On the one hand, this is logical, since there was no macroeconomics and foundation at all. Nevertheless, recent months have taught us that even with an empty calendar of events, the pair shows a very volatile movement and trend. Thus, what is happening with the euro/dollar pair now even looks a little strange. However, we would like to remind you that the pair cannot trade all the time in a trend, and also that the market was ultra volatile last week, so now it is a period of calm and consolidation. The euro tried to resume its upward movement on Tuesday, but rebounded from the Senkou Span B line and the level of 1.0579. Thus, it was not possible to update the previous local high, which casts doubt on the ability of the pair to continue growing in the near future.
There were also few trading signals on Tuesday. Actually, only one. In the middle of the European trading session, the pair rebounded from the extreme level of 1.0579, after which it managed to go down about 35-40 points. Since not a single level or line was worked out during the day, therefore, the short position had to be closed manually in the late afternoon. As a result, the day ended in a small, but profit. Since the total volatility of the day was about 70 points, then 40 points of profit is quite good.
COT report:

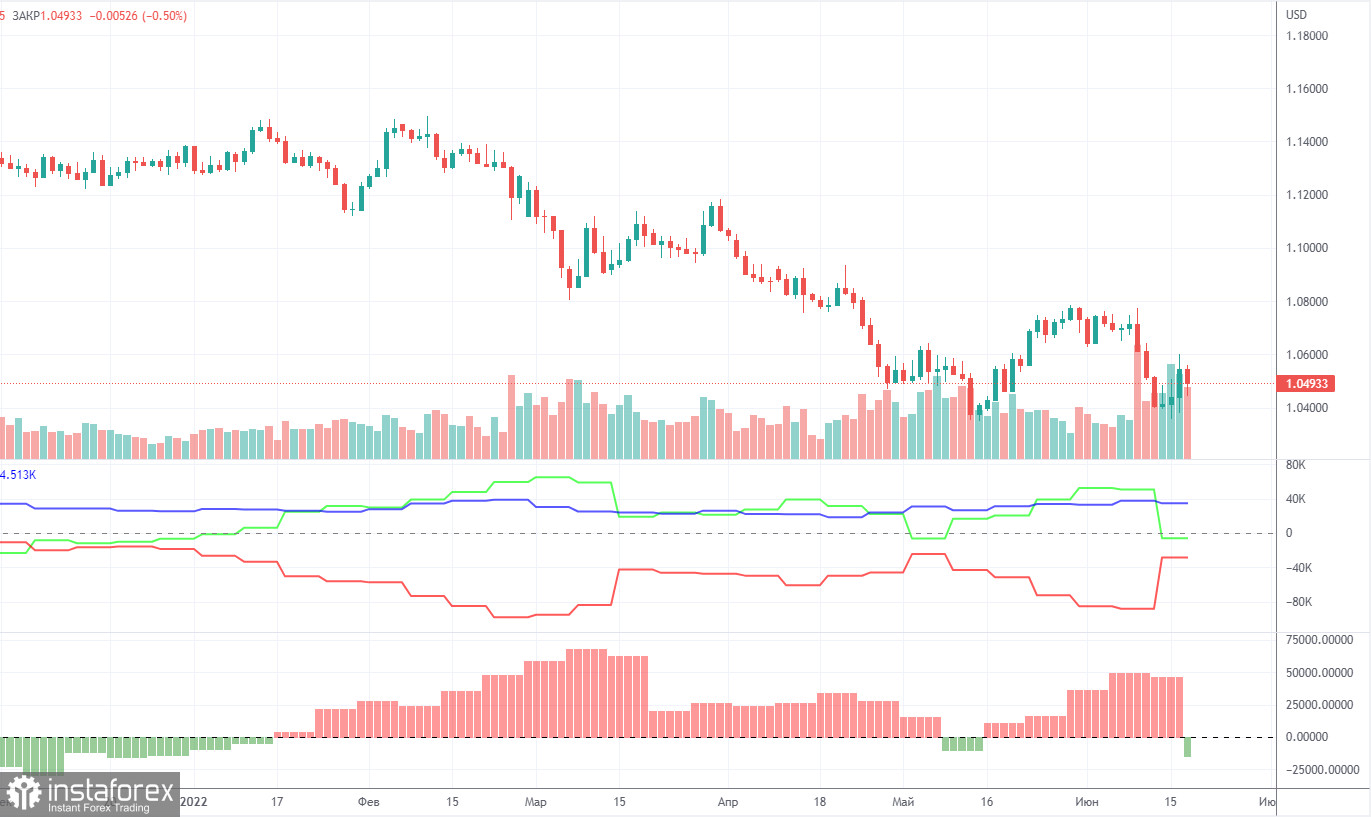
The latest Commitment of Traders (COT) reports on the euro raised a lot of questions. Recall that in the past few months, they showed a blatant bullish mood of professional players, but the euro fell all the time. At this time, the situation is beginning to change, and again, not in favor of the euro. If earlier the mood was bullish, but the euro was falling, now the mood has become bearish... During the reporting week, the number of long positions decreased by 23,200, while the number of shorts in the non-commercial group increased by 33,300. Thus, the net position fell by 56,500 contracts in just a week. From our point of view, this fact very eloquently indicates that now even major players do not believe in the euro. The number of longs is now lower than the number of shorts for non-commercial traders by 6,000. Therefore, we can well expect that now not only the demand for the US dollar will remain strong, but also the demand for the euro will decline. Again, this may lead to an even greater fall in the euro. In principle, over the past few months or even more, the euro has not been able to show even a strong correction, not to mention something more. Its highest upward movement was about 400 points. All fundamental, geopolitical factors remain in favor of the US dollar.
We recommend to familiarize yourself with:
Overview of the EUR/USD pair. June 22. Unexpected speech by Christine Lagarde and euro convulsions.
Overview of the GBP/USD pair. June 22. Again, great. Scotland is again talking about an independence referendum.
Forecast and trading signals for GBP/USD on June 22. Detailed analysis of the movement of the pair and trading transactions.
EUR/USD 1H

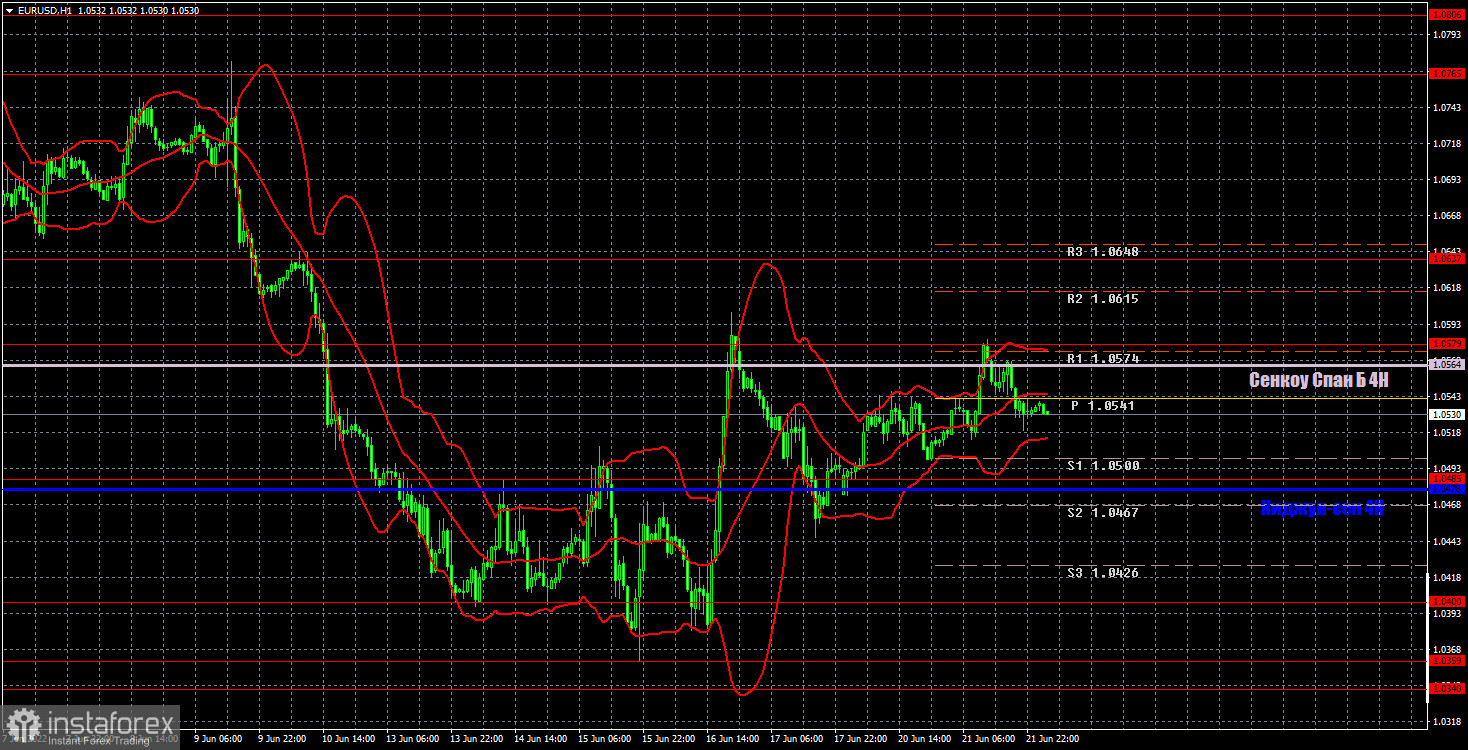
The pair continues to try to continue the upward movement on the hourly timeframe. But the 1.0579 level has already prevented it from rising twice, so for now everything looks like a banal correction, which is already nearing its end. This week there will be very little macroeconomic statistics, so only Federal Reserve Chairman Jerome Powell's dovish speech in Congress on Wednesday and Thursday can help the euro. Today, we highlight the following levels for trading - 1.0340-1.0359, 1.0400, 1.0485, 1.0579, 1.0637, as well as Senkou Span B (1.0564) and Kijun-sen (1 .0478). Ichimoku indicator lines can move during the day, which should be taken into account when determining trading signals. There are also secondary support and resistance levels, but no signals are formed near them. Signals can be "rebounds" and "breakthrough" extreme levels and lines. Do not forget about placing a Stop Loss order at breakeven if the price has gone in the right direction for 15 points. This will protect you against possible losses if the signal turns out to be false. An empty calendar again for Europe. Meanwhile, the first of Powell's two speeches is scheduled for Wednesday. We do not believe that his speech will impress the market, however, one cannot completely deny the likelihood that the market will still work out Powell's speech.
Explanations for the chart:
Support and Resistance Levels are the levels that serve as targets when buying or selling the pair. You can place Take Profit near these levels.
Kijun-sen and Senkou Span B lines are lines of the Ichimoku indicator transferred to the hourly timeframe from the 4-hour one.
Support and resistance areas are areas from which the price has repeatedly rebounded off.
Yellow lines are trend lines, trend channels and any other technical patterns.
Indicator 1 on the COT charts is the size of the net position of each category of traders.
Indicator 2 on the COT charts is the size of the net position for the non-commercial group.
 English
 Русский
 Bahasa Indonesia
 Bahasa Malay
 ไทย
ไทย Español
 Deutsch
 Български
 Français
 Tiếng Việt
 中文
中文 বাংলা
বাংলা हिन्दी
 Čeština
 Українська
 Română

