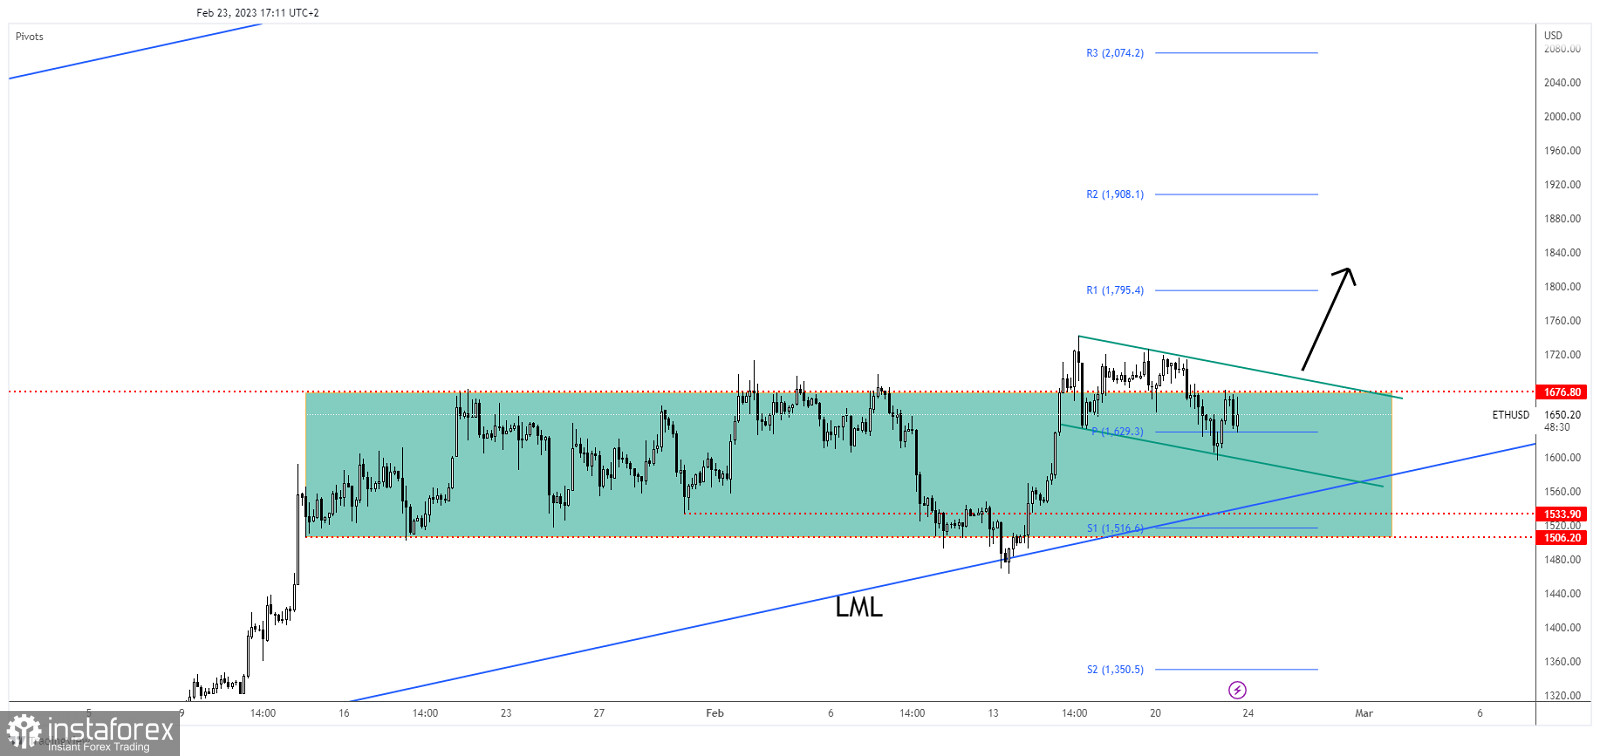
ETH/USD retreated a little which was natural after its strong rally. Now, the price action developed a bullish pattern. The upside pressure remains strong, so further growth could be natural.
In the last 24 hours, ETH/USD is up by 1.94% but it's down by 1.78% in the last 7 days. Technically, altcoin tries to test and retest the near-term downside obstacles before resuming its growth.
ETH/USD Flag Formation!

As you can see on the h1 chart, the rate developed a flag pattern after failing to consolidate above 1,676 broken obstacle. The chart formation should announce further growth.
Technically, as long as it stays above the lower median line (LML) of the major ascending pitchfork. The extended sideways movement is seen as an accumulation pattern.
ETH/USD Forecast!
A valid breakout through the flag's resistance (minor downtrend line) activates further growth and represents a new long signal.
 English
 Русский
 Bahasa Indonesia
 Bahasa Malay
 ไทย
ไทย Español
 Deutsch
 Български
 Français
 Tiếng Việt
 中文
中文 বাংলা
বাংলা हिन्दी
 Čeština
 Українська
 Română

