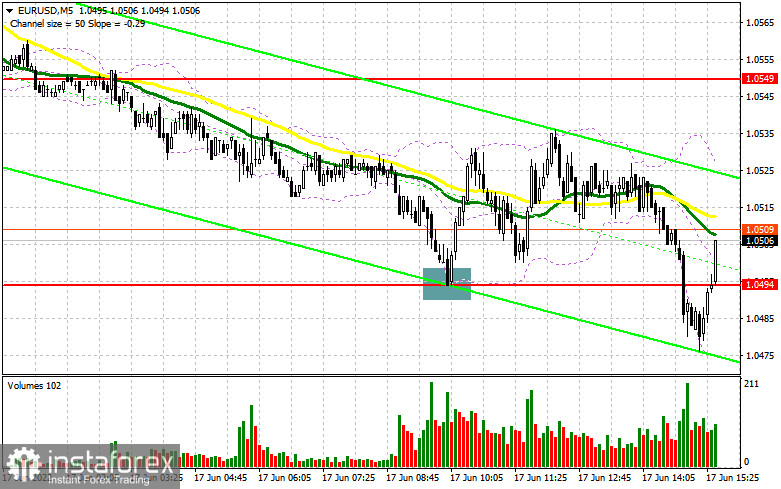
In my forecast this morning, I drew your attention to the level of 1.0494 and recommended entering the market from it. Let's have a look at the 5-minute chart and analyze what happened. The inflation in the eurozone matched economists' expectations, which put pressure on the euro in the first half of the day. Bulls took advantage of this and managed to keep the price above the support of 1.0494. Therefore, a false breakout and a signal to open long positions were formed. As a result, the pair increased by about 40 pips. At the time of writing, bulls are trying to hold the price above 1.0494, so we can expect that the upward correction is likely to continue.

Long positions on EUR/USD:
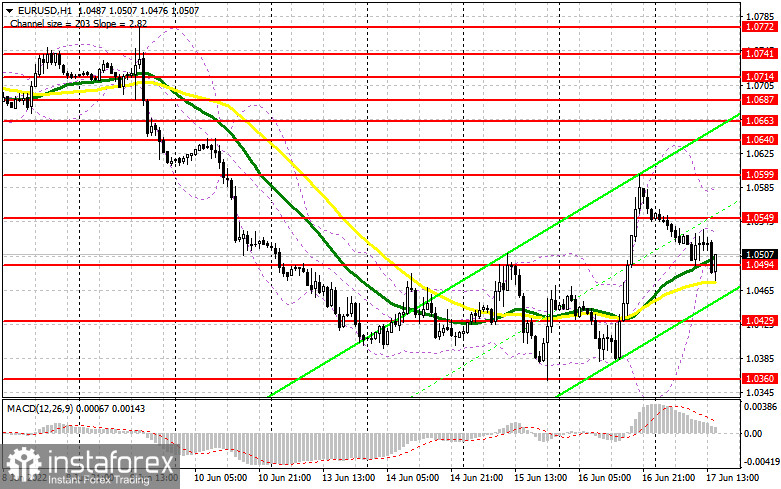
In the afternoon, we expect some releases that may hurt the US dollar, allowing it to regain control over 1.0494. A weak report on US industrial production can push the pair above 1.0494, and a top/bottom test of that level may create a signal for the opening of long positions, aiming to return to 1.0549. If the Fed Chairman's statements do not bring back the demand for the US dollar, it is possible that we will see a breakthrough and a fixation above 1.0549 in the second half of the day. A breakout and a top/bottom test of this level are likely to trigger Stop Loss orders of speculative sellers, which will give a signal to open long positions while allowing a possible correction to 1.0599, where traders may lock in profits. If the EUR/USD pair declines in the afternoon and bulls show weak activity at 1.0494, the pressure on the euro will increase. This would activate buyers' Stop Loss orders, which may push the pair down to 1.0429. It will also allow the pair to lose almost the whole growth gained yesterday, which will threaten the pair's further uptrend next week. The optimal scenario to open long positions there would be a formation of a false breakout. It is better to buy the euro on a rebound only from 1.0360 or even lower near 1.0303, allowing an upward intraday correction of 30-35 pips.
Short positions on EUR/USD:
Bears showed strong activity in the first half of the day and they are counting on good US statistics now. If there is a lack of activity from bulls at 1.0494, the pair may decline, especially if we hear hawkish statements from Powell today. A breakthrough and a consolidation below 1.0494 as well as a retest of this level to the upside, are likely to create an additional sell signal. It may also trigger bulls' Stop Loss orders and a larger decline to 1.0429. A breakthrough of this level is likely to open a direct way to 1.0360 and 1.0303, where traders may close their short positions and generate profit. If the pair rises during the US session after an unsuccessful attempt to consolidate below 1.0494, it would be better to postpone opening short positions until the price reaches the level of 1.0549. The formation of a false breakout at this level will signal a new starting point for the continuation of the bear market. It is possible to sell the euro on a rebound from the high of 1.0599 or 1.0640, allowing a downward correction of 30-35 pips.

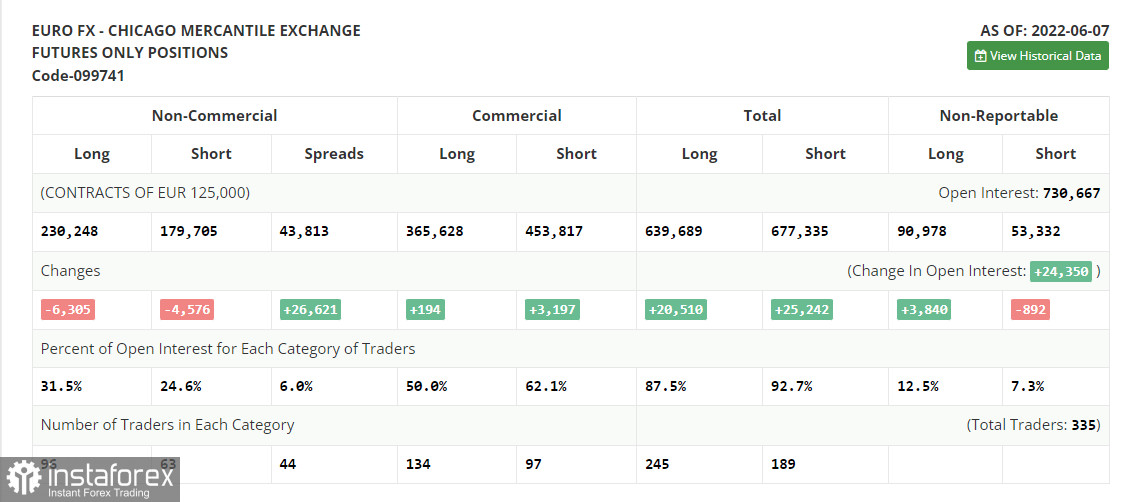
The COT report for June 7 logged a sharp decline in both long and short positions. Many traders were rather cautious about the European Central Bank meeting. For this reason, the market showed quite an idle trading. As time showed - being out of the market was the ideal scenario. The ECB Governing Council said last week that it would raise the rate at the following meeting, but even that did not save the euro in the face of the highest inflation in the US in 40 years. Friday's data last week caused all risky assets to fall, which also affected the European currency. The further direction of EUR/USD will depend on monetary policy decisions made by the Federal Reserve and the outlook for the coming years. If the central bank continues to act aggressively, it is likely that the euro will sink deeper, which may lead the pair to new yearly lows. The COT report showed that long non-commercial positions fell by 6,305 to 230,248, while short non-commercials fell by 4,576 to 179,705. Despite the low quotations on the euro, this does not make it very attractive. On the week, total non-commercial net positions declined to 50,543 from 52,272 a week earlier. The weekly closing price fell to 1.0710 from 1.0742.

- Moving average defines the current trend by smoothing out volatility and noise. Period 50. Marked in yellow on the chart.
- Moving average defines the current trend by smoothing out volatility and noise. Period 30. Marked in green on the chart.
- MACD (Moving Average Convergence/Divergence) indicator Fast EMA of period 12. Slow EMA period 26. SMA period 9
- Bollinger Bands. Period 20
- Non-commercial traders are speculators, such as individual traders, hedge funds, and large institutions, which use the futures market for speculative purposes and meet certain requirements.
- Long non-commercial positions represent the total long open position of non-commercial traders.
- Short non-commercial positions represent the total short open position of non-commercial traders.
- Total non-commercial net position is the difference between the short and long positions of non-commercial traders.
 English
 Русский
 Bahasa Indonesia
 Bahasa Malay
 ไทย
ไทย Español
 Deutsch
 Български
 Français
 Tiếng Việt
 中文
中文 বাংলা
বাংলা हिन्दी
 Čeština
 Українська
 Română

