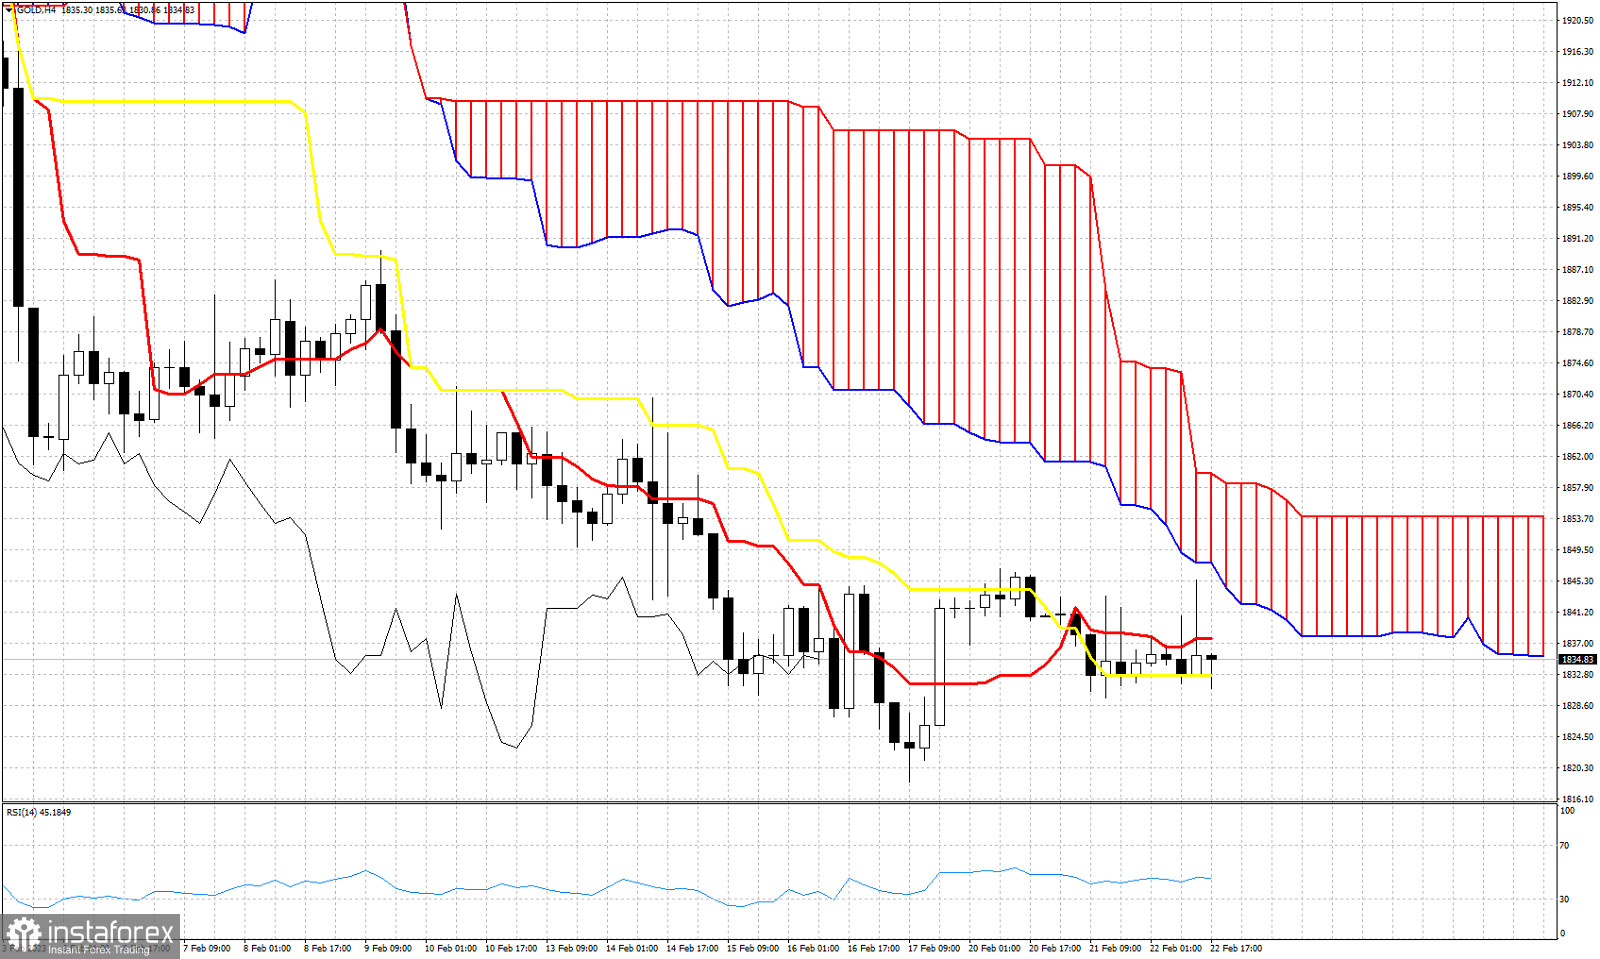
According to the Ichimoku cloud indicator Gold price remains in a bearish trend as price is still below the 4 hour Kumo. At the beginning of February we got our last important signal in Gold when price broke below the Kumo at $1,922. Since then trend is bearish. The tenkan-sen (red line indicator) and the kijun-sen (yellow line indicator) provide near term support and resistance. Support by the kijun-sen is at $1,832 and resistance by the tenkan-sen at $1,837. The lower cloud boundary is key resistance at $1,847. It can be tested again if bulls push price above $1,837. The Chikou span (black line indicator) is still bellow the candlestick pattern (bearish). Over the next couple of sessions by the end of the week I expect to see an increase in volatility. Inability to break above $1,837 will lead to rejection and a push towards $1,820. Recapturing $1,837 will lead to a push towards the Kumo.
 English
 Русский
 Bahasa Indonesia
 Bahasa Malay
 ไทย
ไทย Español
 Deutsch
 Български
 Français
 Tiếng Việt
 中文
中文 বাংলা
বাংলা हिन्दी
 Čeština
 Українська
 Română

