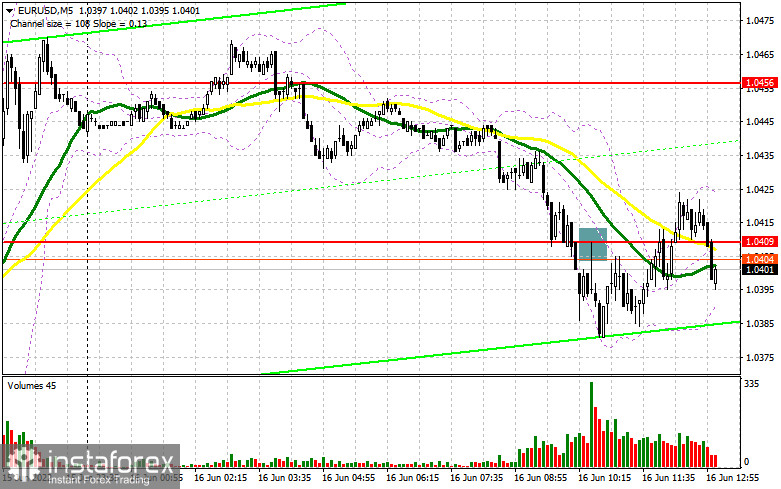
In the morning article, I highlighted the level of 1.0409 and recommended taking decisions with this level in focus. Now let's look at the 5-minute chart and try to figure out what actually happened. The eurozone macro stats did not help the euro rebound. They were in line with economists' forecasts. The euro/dollar pair broke through 1.0409 after an upward test of this level. It gave an excellent sell signal with prospects of a further decline although yesterday, the pair halted its drop. However, I did not see a significant downward movement at the time of writing the article. As long as trading is carried out below 1.0409, the euro is likely to fall deeper. If the price rises above this level again, I recommend closing positions and waiting for new signals. There have been changes in the technical outlook as well.

What is needed to open long positions on EUR/USD
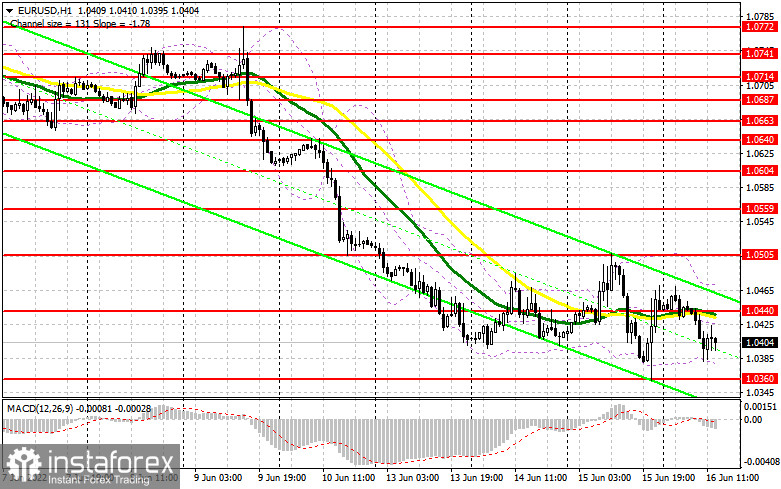
Given that the bearish pressure on the euro has intensified and it struggles to pick up a trajectory, I decided not to open new positions, waiting for clearer entry points. For this reason, I revised the target levels. The US data is likely to strip up market activity. I would advise traders to pay attention to the building permits report and the Philly Fed Manufacturing Activity Index. If the number of initial jobless claims in the United States suddenly turns out to be much lower than expected, the US dollar may slump to the yearly lows. At those levels, bears and bulls are likely to tussle for the further trajectory of the pair. If the price declines, the bulls will have to try very hard to protect 1.0360. Only a false breakout of this level will provide buying opportunities. Besides, the euro is likely to return to 1.0440, the level formed in the morning. A breakout and a downward test of this level will force sellers to close stop-loss orders. It will give a new buy signal. In this case, a correction to 1.0505 is likely to occur. Yesterday, the price failed to grow above this level. A more distant target will be the 1.0559 level where I recommend locking in profits. If EUR/USD sinks in the afternoon and bulls show no activity at 1.0360, the pressure on the euro will escalate. Bulls will have to close their stop-loss orders, pushing the pair to 1.0306. It is better to open long positions at this level only after a false breakout. You can buy EUR/USD immediately at a bounce from the 1.0255 level or even the low of 1.0194, keeping in mind an intraday upward correction of 30-35 pips.
What is needed to open short positions on EUR/USD
The bears took control over the market in the first half of the day. They are counting on the positive US reports. Yesterday's rise in the euro was rather odd given the FOMC meeting results and the key rate decision. Therefore, a further fall of the pair looks more likely, especially in case of an unsuccessful attempt to push the price to 1.0440. A false breakout of this level will generate an excellent sell signal with the prospect of a drop to 1.0360. A retest of this level could trigger a sharp upward movement if there are still bulls in the market. If this scenario does not come true, it is better to open short positions. A new sell signal will appear after a breakout and a dip below this level, as well as an upward test. Bulls will rush to close stop-loss orders, pushing the pair movement to 1.0306. A breakout and a drop below 1.0306 will open the path to 1.0255 and 1.0194, where I recommend closing all short positions. If EUR/USD climbs during the American session amid a sharp sudden decrease in short positions as it was yesterday and bears show no energy at 1.0440, I would advise you to postpone short positions until the price reaches 1.0505. A false breakout of this level will signal the continuation of the bear market. You can sell EUR/USD immediately at a bounce from 1.0559 or the high of 1.0604, keeping in mind a downward correction of 30-35 pips.

COT report
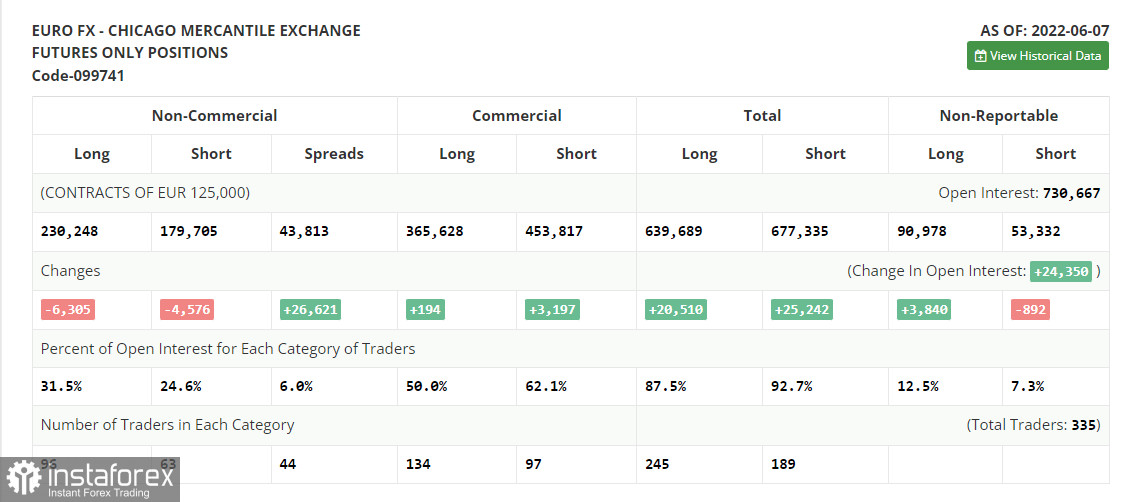
The COT report (Commitment of Traders) for June 7 logged a sharp drop in both long and short positions. Many traders were rather cautious ahead of the ECB meeting. For this reason, markets remained thin. As it turned out, those traders who stayed out of the market had picked the right strategy. Last week, the ECB said it would raise the interest rate at its next meeting. However, even such hawkish statements did not help the euro remain at its levels. it dropped sharply following the release of the IS CPI index. Inflation hit a four-decade high. The reports published last Friday triggered a fall in risk appetite as well as the euro. The further trajectory of EUR/USD will depend on the Fed's monetary policy decisions and its long-term projections. If the central bank stocks to a hawkish approach, the euro will sink to yearly lows. The COT report revealed that the number of long non-commercial positions decreased by 6,305 to 230,248, while the number of short non-commercial positions fell by 4,576 to 179,705. Even though the euro is trading at low levels, it does not make it attractive for traders. At the end of the week, the total non-commercial net position dropped and amounted to 50,543 against 52,272 a week earlier. The weekly closing price dipped to 1.0710 against 1.0742.

Signals of technical indicators
Moving averages
EUR/USD is trading below 30- and 50-period moving averages. It means that the bears are trying to take the upper hand/
Remark. The author is analyzing the period and prices of moving averages on the 1-hour chart. So, it differs from the common definition of classic daily moving averages on the daily chart.
Bollinger Bands
In case of a decline, the lower border of 1.0390 will act as support.
A breakout of the upper border at about 1.1337 will trigger a new bullish wave of EUR. Alternatively, a breakout of the lower border at about 1.1305 will escalate pressure on EUR/USD.
Definitions of technical indicators
- Moving average recognizes an ongoing trend through leveling out volatility and market noise. A 50-period moving average is plotted yellow on the chart.
- Moving average identifies an ongoing trend through leveling out volatility and market noise. A 30-period moving average is displayed as the green line.
- MACD indicator represents a relationship between two moving averages that is a ratio of Moving Average Convergence/Divergence. The MACD is calculated by subtracting the 26-period Exponential Moving Average (EMA) from the 12-period EMA. A 9-day EMA of the MACD called the "signal line".
- Bollinger Bands is a momentum indicator. The upper and lower bands are typically 2 standard deviations +/- from a 20-day simple moving average.
- Non-commercial traders - speculators such as retail traders, hedge funds, and large institutions who use the futures market for speculative purposes and meet certain requirements.
- Non-commercial long positions represent the total long open position of non-commercial traders.
- Non-commercial short positions represent the total short open position of non-commercial traders.
- The overall non-commercial net position balance is the difference between short and long positions of non-commercial traders.
 English
 Русский
 Bahasa Indonesia
 Bahasa Malay
 ไทย
ไทย Español
 Deutsch
 Български
 Français
 Tiếng Việt
 中文
中文 বাংলা
বাংলা हिन्दी
 Čeština
 Українська
 Română

