 English
  Русский
 Bahasa Indonesia
 Bahasa Malay
 ไทย
ไทย Español
 Deutsch
 Български
 Français
 Tiếng Việt
 中文
中文 বাংলা
বাংলা हिन्दी
 Čeština
 Українська
 Română

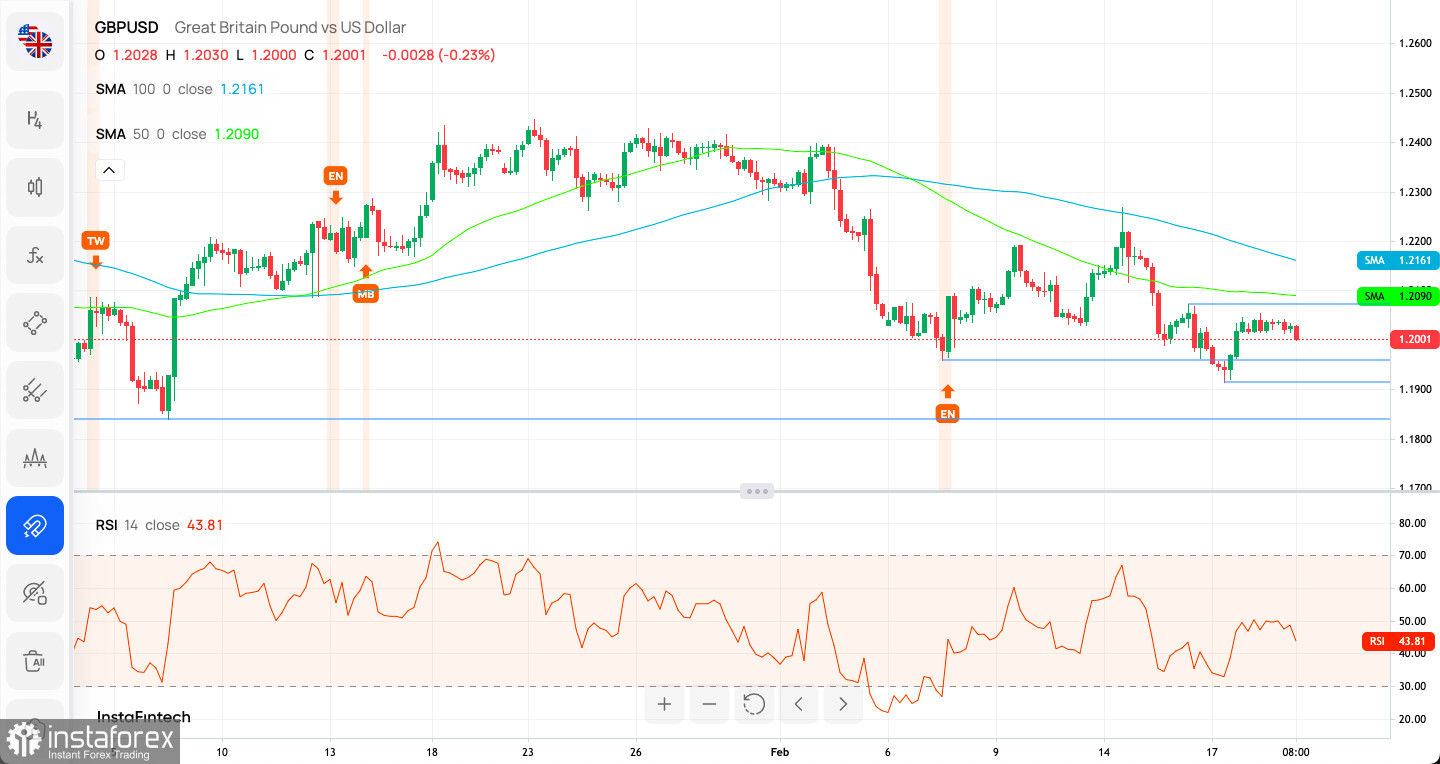
Technical Market Outlook:
The GBP/USD pair has made a local low at the level of 1.1914 and keeps trading down. The 50 and 100 MA are above the current price, so the market is under the bearish control. The level of 1.2193 and 1.2272 will now act as a technical resistance as well, so a breakout above this level of needed in order to rally higher. The intraday technical resistance is seen at 1.2068. The momentum is weak and negative, pointing to the downside, so now the sell-off will likely extend towards the level of 1.1937 and 1.1840. Please be aware of the 50 MA and 100 MA bearish cross on the H4 time frame as well.
Weekly Pivot Points:
WR3 - 1.21250
WR2 - 1.20826
WR1 - 1.20665
Weekly Pivot - 1.20402
WS1 - 1.20241
WS2 - 1.19978
WS3 - 1.19554
Trading Outlook:
So far the level of 1.2443 was too strong resistance to break through, so a potential Double Top price pattern is still in play. Moreover, the level of 1.2297 which is 50% Fibonacci retracement level of the last big wave down had been hit, so the bears resumed the down trend. The confirmation of the pattern comes with the level of 1.2089 breakout (50 WMA) with a potential target at the level of 1.1840 or below