 English
  Русский
 Bahasa Indonesia
 Bahasa Malay
 ไทย
ไทย Español
 Deutsch
 Български
 Français
 Tiếng Việt
 中文
中文 বাংলা
বাংলা हिन्दी
 Čeština
 Українська
 Română

Technical outlook:
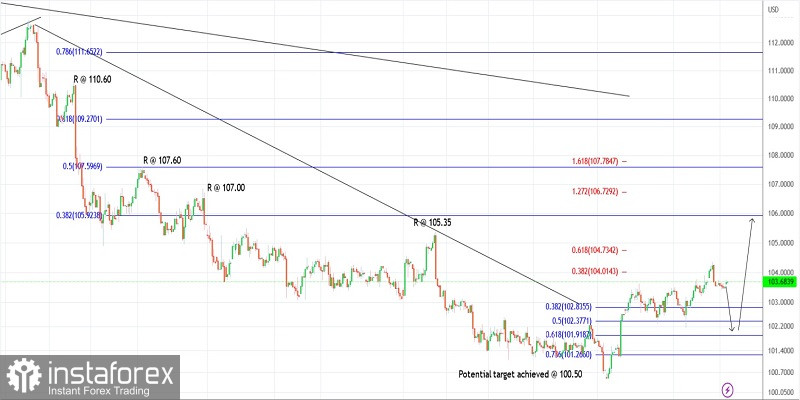
The US dollar index dropped through the 103.45 low intraday on Monday before finding mild bids. The index has pulled back a bit and is seen to be trading close to 103.70 at this point in writing. Intraday resistance is seen through 103.85 as the bears will be inclined to drag prices towards 102.80 and down to 102.00 levels in the near term.
The US dollar index is broadly unfolding a corrective rally towards 106.50 and up to 109.00-50 levels after carving a potential bottom at 100.50 early this month. Within the corrective rally, prices are producing a counter-trend drop to 102.80 at least, before turning higher again. Ideally, the bulls will be inclined to hold prices above the 100.50 interim support.
The US dollar index had earlier dropped from 114.70 to 100.50 carving a larger-degree bearish wave. The above is being retraced as discussed earlier and prices are expected to reach 106.00 in the near term. Also, note that 109.50 is the Fibonacci 0.618 retracement of the earlier drop, hence a high probability remains for a bearish reversal.
Trading idea:
A potential bullish move against 100.50
Good luck!