 English
  Русский
 Bahasa Indonesia
 Bahasa Malay
 ไทย
ไทย Español
 Deutsch
 Български
 Français
 Tiếng Việt
 中文
中文 বাংলা
বাংলা हिन्दी
 Čeština
 Українська
 Română

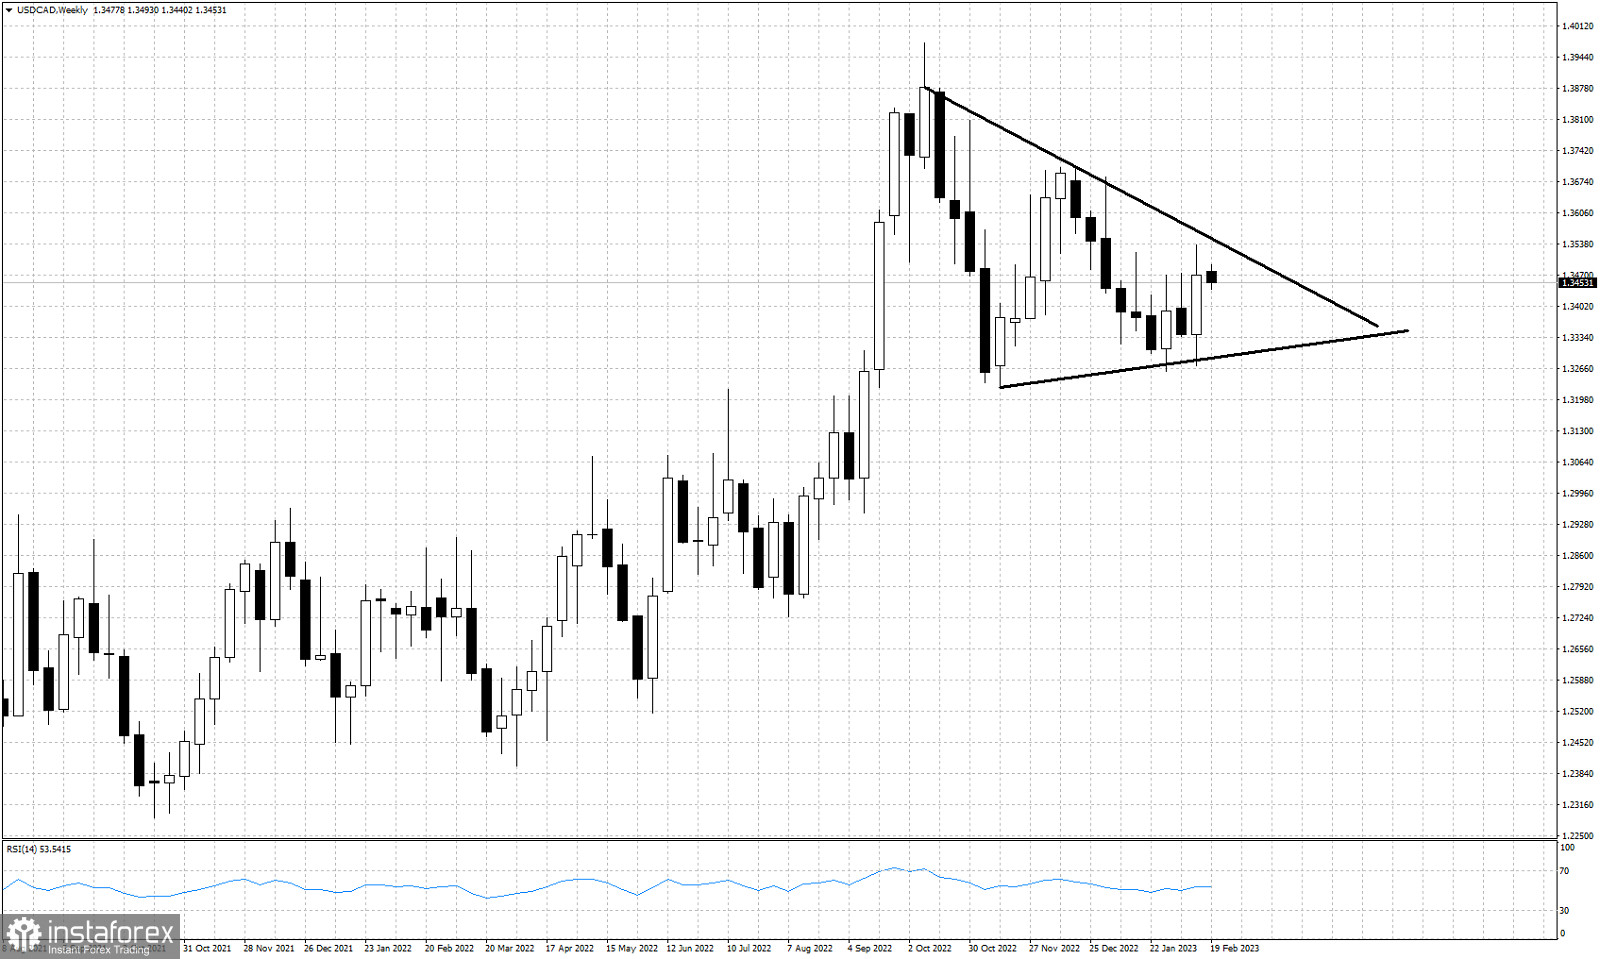
Black lines- triangle pattern
USDCAD is trading around 1.3453. Price has formed over the last few months a triangle pattern. The upper triangle boundary provides resistance at 1.3550, while the lower triangle boundary at 1.3290 provides support. Currently we see a possible rejection at the upper triangle boundary. This makes USDCAD more vulnerable to a pull back towards 1.3290. Failure to hold above the lower triangle boundary will open the way for a move towards 1.28. On the other hand if price breaks above and out of the triangle pattern, we should then expect USDCAD to form new highs above 1.3705.