When to go long on GBP/USD:
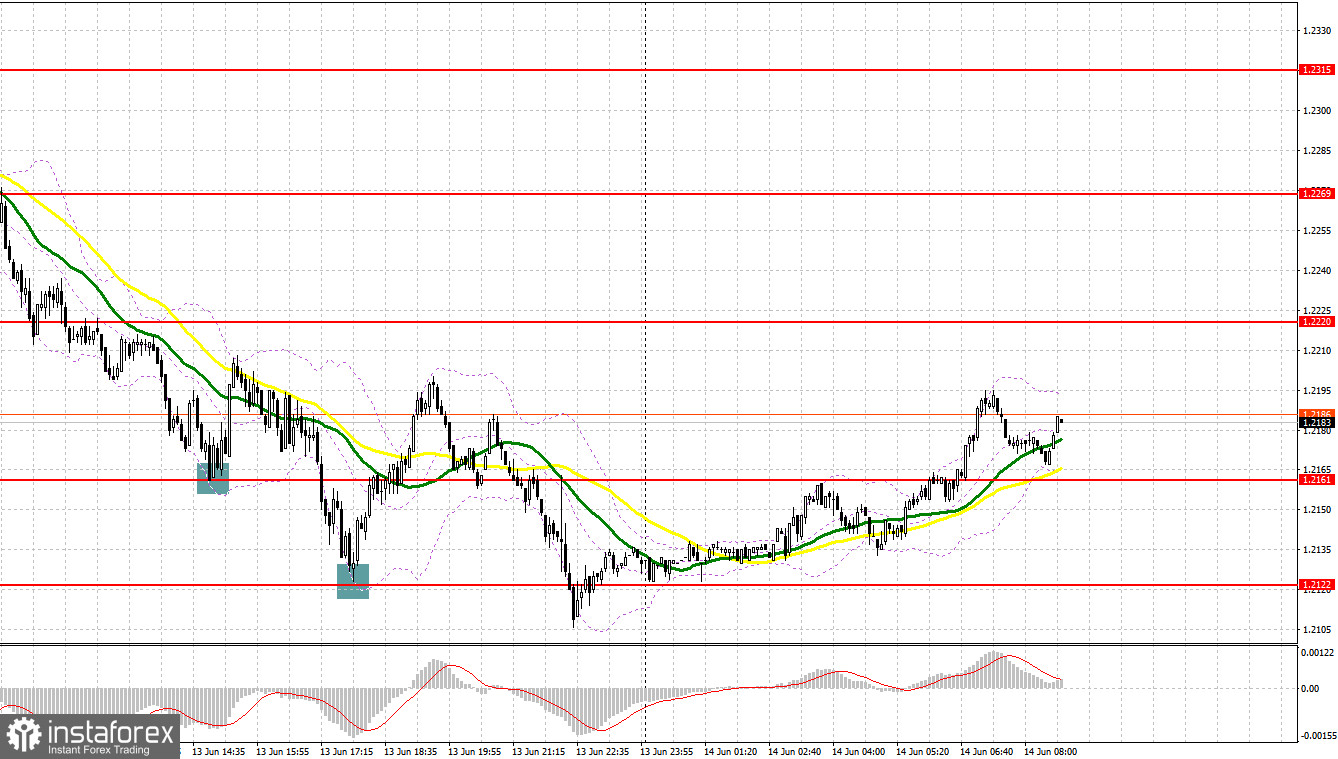
Several good market entry signals were formed yesterday. Let's take a look at the 5-minute chart and see what happened. A false breakout at 1.2237 resulted in a signal to open long positions, which made it possible for the pound to return back to 1.2275 and we could take about 40 points from the market. A false breakout at 1.2275 created a great sell signal further down the trend, resulting in a major pair drop of over 60 points. A breakthrough and update of 1.2237 from the bottom up is another sell signal with a downward movement of 37 points. In the afternoon, I waited for the pound to decline and form a false breakout at 1.2161 - a buy signal, which allowed the pair to correct by more than 40 points. Then another wave of decline took place, which led to a test and a false breakout at 1.2122. As a result, a buy signal and a rebound by more than 70 points.

COT report:
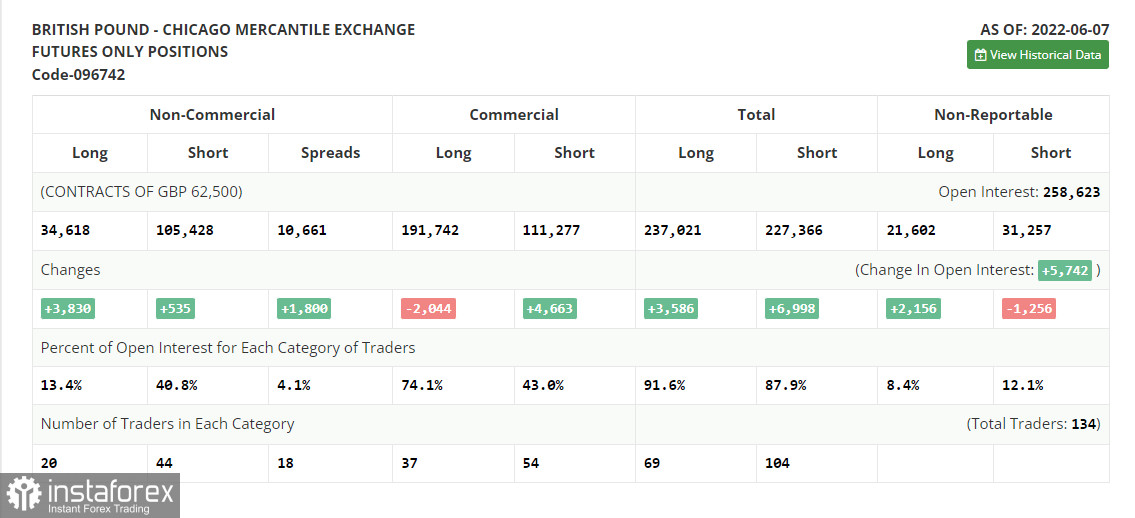
Before analyzing the technical picture of the pound, let's look at what happened in the futures market. The Commitment of Traders (COT) report for June 7 logged a sharp increase in long positions and only a small growth in short ones. However, as I think you understand, at the moment the picture is completely different: the last three trading days have turned the market upside down. The pair's succeeding direction, which is in the area of annual lows, depends on the Federal Reserve meeting and on the decisions taken at it. A more aggressive policy will push GBP/USD further down, as the UK economy, as the latest data showed, is gradually reducing the growth rate, which does not give confidence to investors. The Bank of England meetings are unlikely to help the pound in any way, since the central bank will not abandon the policy of raising rates. I very much doubt its further aggressive actions aimed at combating inflation by sacrificing the growth rate of the economy. Although BoE Governor Andrew Bailey continues to say that the central bank is not going to give up on raising interest rates yet, however, there are also no hints of a more aggressive approach to monetary policy.
The COT report indicates that long non-commercial positions increased by 3,830 to the level of 34,618, while short non-commercial positions increased by 535 to the level of 105,428. This led to a decrease in the negative value of the non-commercial net position from the level of -74,105 to the level of -70,810. The weekly closing price rose 1.2481 to 1.2511.

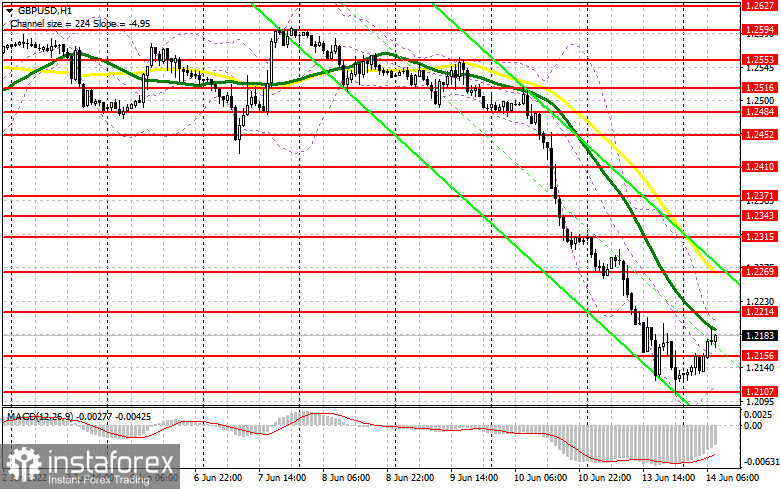
Data on the UK labor market will give only temporary support to the pound, and provided that the reports come out better than economists' forecasts. Much will depend on the change in the number of applications for unemployment benefits in the UK, as well as on the average wage rate. Household income growth is likely to have a positive impact on the pace of retail sales, which have slowed down significantly in recent months due to high inflation, which is negatively affecting the economy. Given how actively the bears tried to settle below the annual lows yesterday, it seems to me that the bulls will have to defend the intermediate support at 1.2156 very soon. Weak data will most certainly lead to a test of this level. Having missed it, a new major sell-off of the pound is unlikely to be avoided. A false breakout at this level will give a buy signal that can keep the GBP/USD within the correction channel, counting on a return to the level of 1.2214, slightly above which the moving averages are already playing on the bears' side. Consolidating above 1.2214 will strengthen the demand for the pound and lead to an increase in the area of rather large resistance at 1.2269. Bulls will obviously take a break there before the central banks' meetings, which will begin tomorrow. A more distant target will be the area of 1.2315, where I recommend taking profits.
In case the pound falls during the European session and the lack of activity at 1.2156, in my opinion this is a more likely option, I advise you to postpone long positions until the support of 1.2107. Forming a false breakout there will give an entry point into long positions, counting on maintaining the pair at least in the horizontal channel. You can buy GBP/USD immediately on a rebound from 1.2068, or even lower - around 1.2030 with the goal of a correction of 30-35 points within the day.
When to go short on GBP/USD:
The bears continue to control the market, although they may take a break, since it is the Fed's policy that will determine the direction of risky assets traded in tandem with the US dollar. Any changes could lead to a continuation of the bear market and a larger drop in the pair. I advise you to open short positions today only after forming a false breakout at 1.2214, which was formed following the results of yesterday. This will give an entry point to short positions with the goal of a succeeding fall in the pair and a subsequent update of support at 1.2156. A bigger struggle will unfold for this level, as the bulls will try to build the lower border of the new upward corrective channel there. Only a breakdown and reverse test of this level from below will bring the GBP/USD to a low of 1.2107, leaving a good opportunity to update support at 1.2068. A more distant target will be the area of 1.2030, where I recommend taking profits.
If the pair grows during the European session and there are no bears at 1.2214, nothing bad will happen. In this case, I advise you to postpone short positions until 1.2269. I advise you to sell the pound there only after a false breakout. You can open short positions immediately for a rebound from a new monthly high of 1.2315, or even higher - from 1.2343, based on a correction of the pair down by 30-35 points within the day.

I recommend to read:
Indicator signals:
Moving averages
Trading is below 30 and 50 moving averages, which indicates a continuation of the bear market.
Note: The period and prices of moving averages are considered by the author on the H1 hourly chart and differs from the general definition of the classic daily moving averages on the daily D1 chart.
Bollinger Bands
A breakthrough of the lower border of the indicator in the area of 1.2107 will increase pressure on the pair. If the pair grows, the upper border of the indicator around 1.2210 will act as resistance.
Description of indicators
- Moving average (moving average, determines the current trend by smoothing out volatility and noise). Period 50. It is marked in yellow on the chart.
- Moving average (moving average, determines the current trend by smoothing out volatility and noise). Period 30. It is marked in green on the chart.
- MACD indicator (Moving Average Convergence/Divergence — convergence/divergence of moving averages) Quick EMA period 12. Slow EMA period to 26. SMA period 9
- Bollinger Bands (Bollinger Bands). Period 20
- Non-commercial speculative traders, such as individual traders, hedge funds, and large institutions that use the futures market for speculative purposes and meet certain requirements.
- Long non-commercial positions represent the total long open position of non-commercial traders.
- Short non-commercial positions represent the total short open position of non-commercial traders.
- Total non-commercial net position is the difference between short and long positions of non-commercial traders.
 English
 Русский
 Bahasa Indonesia
 Bahasa Malay
 ไทย
ไทย Español
 Deutsch
 Български
 Français
 Tiếng Việt
 中文
中文 বাংলা
বাংলা हिन्दी
 Čeština
 Українська
 Română

