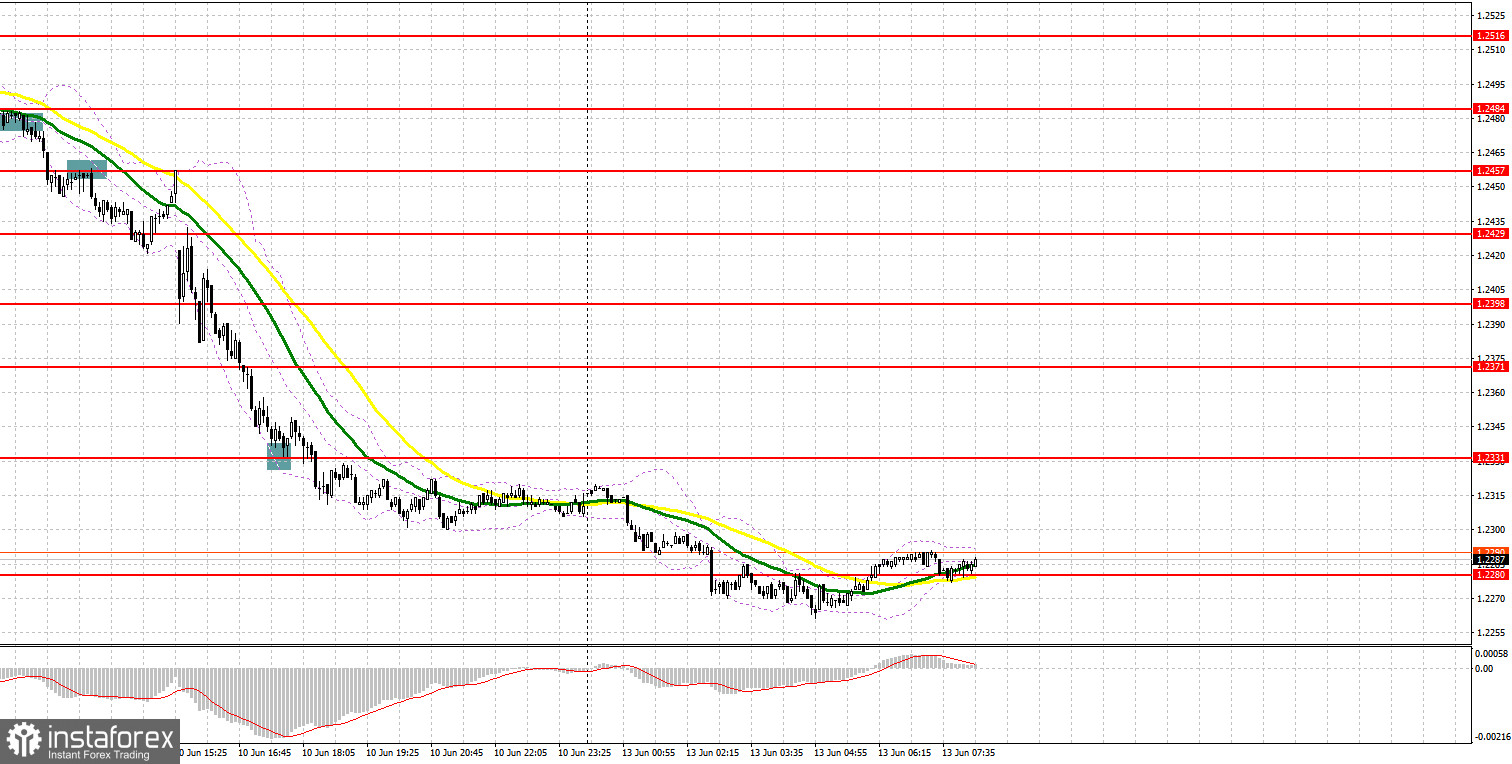
On Friday, there were several good entry points. Now let's look at the 5-minute chart and try to figure out what actually happened. In the morning article, I highlighted the level of 1.2480 and recommended taking decisions with this level in focus. A buy signal appeared after a false breakout in the first half of the day. However, the upward movement was not strong enough. After some time, the bears regained control over 1.2480. An upward test led to a sell signal. As a result, the pound sterling quickly fell to 1.2457 and settled lower, giving an additional signal for short positions. Following the release of US inflation data, the pound sterling collapsed to 1.2389. It lost more than 100 pips. In the afternoon, the downward movement continued almost without any corrections. As seen on the chart, the bulls tried to push the pair to 1.2331 but failed.

What is needed to open long positions on GBP/USD
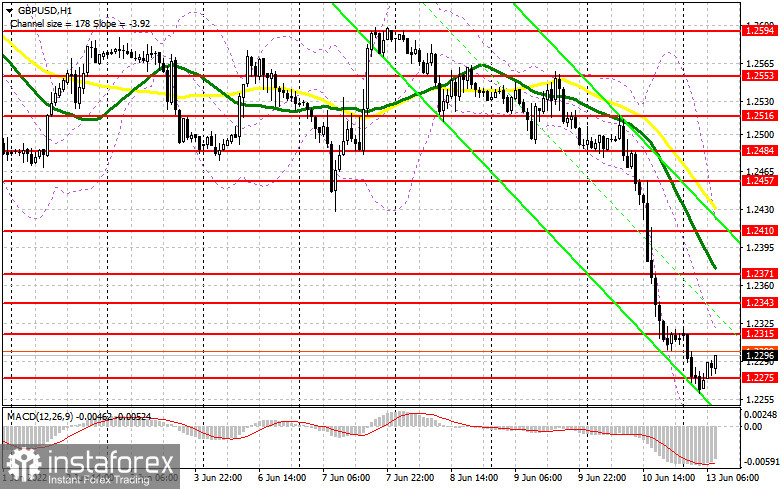
Today, the macroeconomic calendar for the UK is quite eventful. The British currency is likely to face a new wave of sell-off following the publication of fresh reports. Figures are expected to be disappointing as the UK economy struggles with soaring consumer prices. Besides, the Bank of England is reluctant to abandon its ultra-soft stance on monetary policy. In the first half of the day, the pound sterling could fall lower. Therefore, the bulls should go the extra mile to protect the new support level of 1.2275. This level is temporal, so I will not open positions at this level. Only a false breakout will give a buy signal as well as an upward correction to the nearest resistance of 1.2315. An equally important task for the bulls will be to take control over this level. It will only slightly limit the downward movement of the pair. However, it will hardly trigger a trend reversal. A breakout and a downward test of 1.2315 will provide a buy signal with a prospect of a rise to 1.2343 where I recommend locking in profits. A more distant target will be the 1.2371 level. If the pound sterling falls and bulls show no activity at 1.2275, the pressure on the pair will only escalate. If so, the price will continue the path to the yearly low of 1.2237. It is better to enter the market at this level after a false breakout. You can buy GBP/USD immediately at a bounce from 1.2201 or even a low of 1.2161, keeping in mind an upward intraday correction of 30-35 pips.
What is needed to open short positions on GBP/USD
Bears are now in control. They will certainly try to push the pair below 1.2275 in the first half of the day. Everything will depend on the UK GDP report. A downbeat reading will lead to the implementation of a new strategy to sell the pound. A drop below 1.2275 and an upward test of this level will generate a sell signal with the prospect of a drop to 1.2237 and 1.2201. At this level, I recommend locking in profits. A more distant target will be the 1.2161 level. If GBP/USD rises, the bears will probably try to defend the nearest resistance level of 1.2315. A false breakout of this level will give a good entry point into short positions in the expectation of a resumption of the downtrend. If bears show no energy at 1.2315, a small upward jump may occur against the background of a decline in stop-loss orders of sellers. In this case, I would advise you to postpone short positions until 1.2343. It is better to open short positions on the pound sterling at this level only after a false breakout. You can sell the pound sterling immediately at a bounce from 1.2371 or even a high of 1.2410, keeping in mind a downward intraday correction of 30-35 pips.

COT report
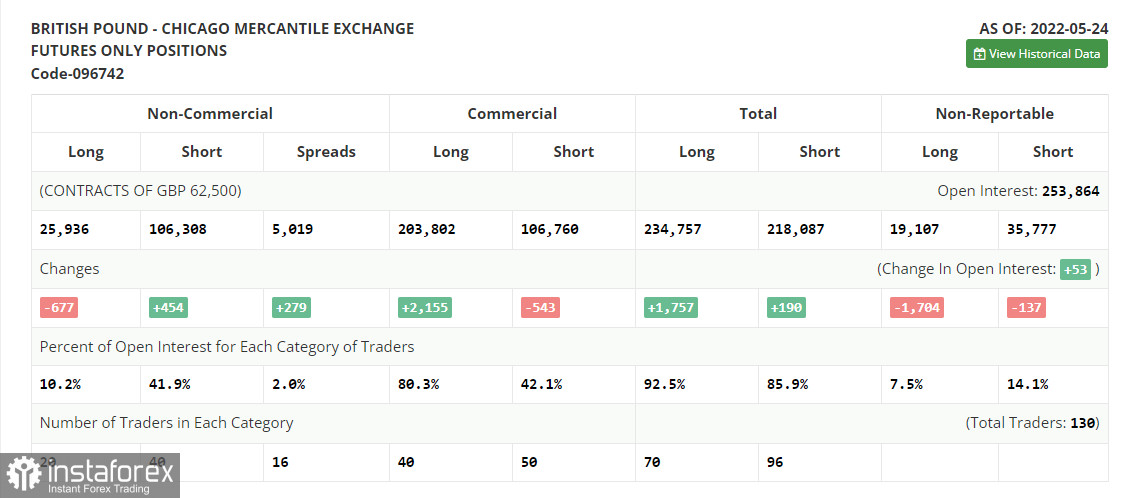
The COT report (Commitment of Traders) for May 24 logged a drop in long positions and an increase in short ones. However, it did not significantly affect market sentiment. Despite a rally of the pound sterling since the middle of May, the bears remain in control. Apparently, the GBP/USD pair slightly recovered only amid the lack of fundamental reports, which usually caused sharp drops in the pair, and small profit-taking at yearly lows. There were no other reasons for its rise. The economy is slowly but surely sliding into recession. Inflation reaches new record levels. Household spending is steadily rising. The Bank of England is now sitting on the sidelines. BoE Governor Andrew Bailey has recently confirmed once again that the regulator will keep raising the key rate. There are rumors that the US central bank plans to take a pause in its tightening cycle in September of this year. The US dollar slightly declined amid such rumors, while the pound sterling managed to add gains. The COT report for May 24 revealed that the number of long non-commercial positions decreased by 667 to 25,936, while the number of short non-commercial positions advanced by 454 to 106,308. This led to an increase in the negative delta of the non-commercial net position to 80,372 from 79,241. The weekly closing price rose to 1.2511 from 1.2481.

Signals of technical indicators
Moving averages
GBP/USD is trading below 30- and 50-period moving averages, indicating the continuation of the downtrend.
Remark. The author is analyzing the period and prices of moving averages on the 1-hour chart. So, it differs from the common definition of classic daily moving averages on the daily chart.
Bollinger Bands
In case of a decline, the lower border at 1.2235 will act as support. In case of a rise, the 1.2315 area will act as resistance.
Definitions of technical indicators
- Moving average recognizes an ongoing trend through leveling out volatility and market noise. A 50-period moving average is plotted yellow on the chart.
- Moving average identifies an ongoing trend through leveling out volatility and market noise. A 30-period moving average is displayed as the green line.
- MACD indicator represents a relationship between two moving averages that is a ratio of Moving Average Convergence/Divergence. The MACD is calculated by subtracting the 26-period Exponential Moving Average (EMA) from the 12-period EMA. A 9-day EMA of the MACD called the "signal line".
- Bollinger Bands is a momentum indicator. The upper and lower bands are typically 2 standard deviations +/- from a 20-day simple moving average.
- Non-commercial traders - speculators such as retail traders, hedge funds and large institutions who use the futures market for speculative purposes and meet certain requirements.
- Non-commercial long positions represent the total long open position of non-commercial traders.
- Non-commercial short positions represent the total short open position of non-commercial traders.
- The overall non-commercial net position balance is the difference between short and long positions of non-commercial traders.
 English
 Русский
 Bahasa Indonesia
 Bahasa Malay
 ไทย
ไทย Español
 Deutsch
 Български
 Français
 Tiếng Việt
 中文
中文 বাংলা
বাংলা हिन्दी
 Čeština
 Українська
 Română

