 English
  Русский
 Bahasa Indonesia
 Bahasa Malay
 ไทย
ไทย Español
 Deutsch
 Български
 Français
 Tiếng Việt
 中文
中文 বাংলা
বাংলা हिन्दी
 Čeština
 Українська
 Română

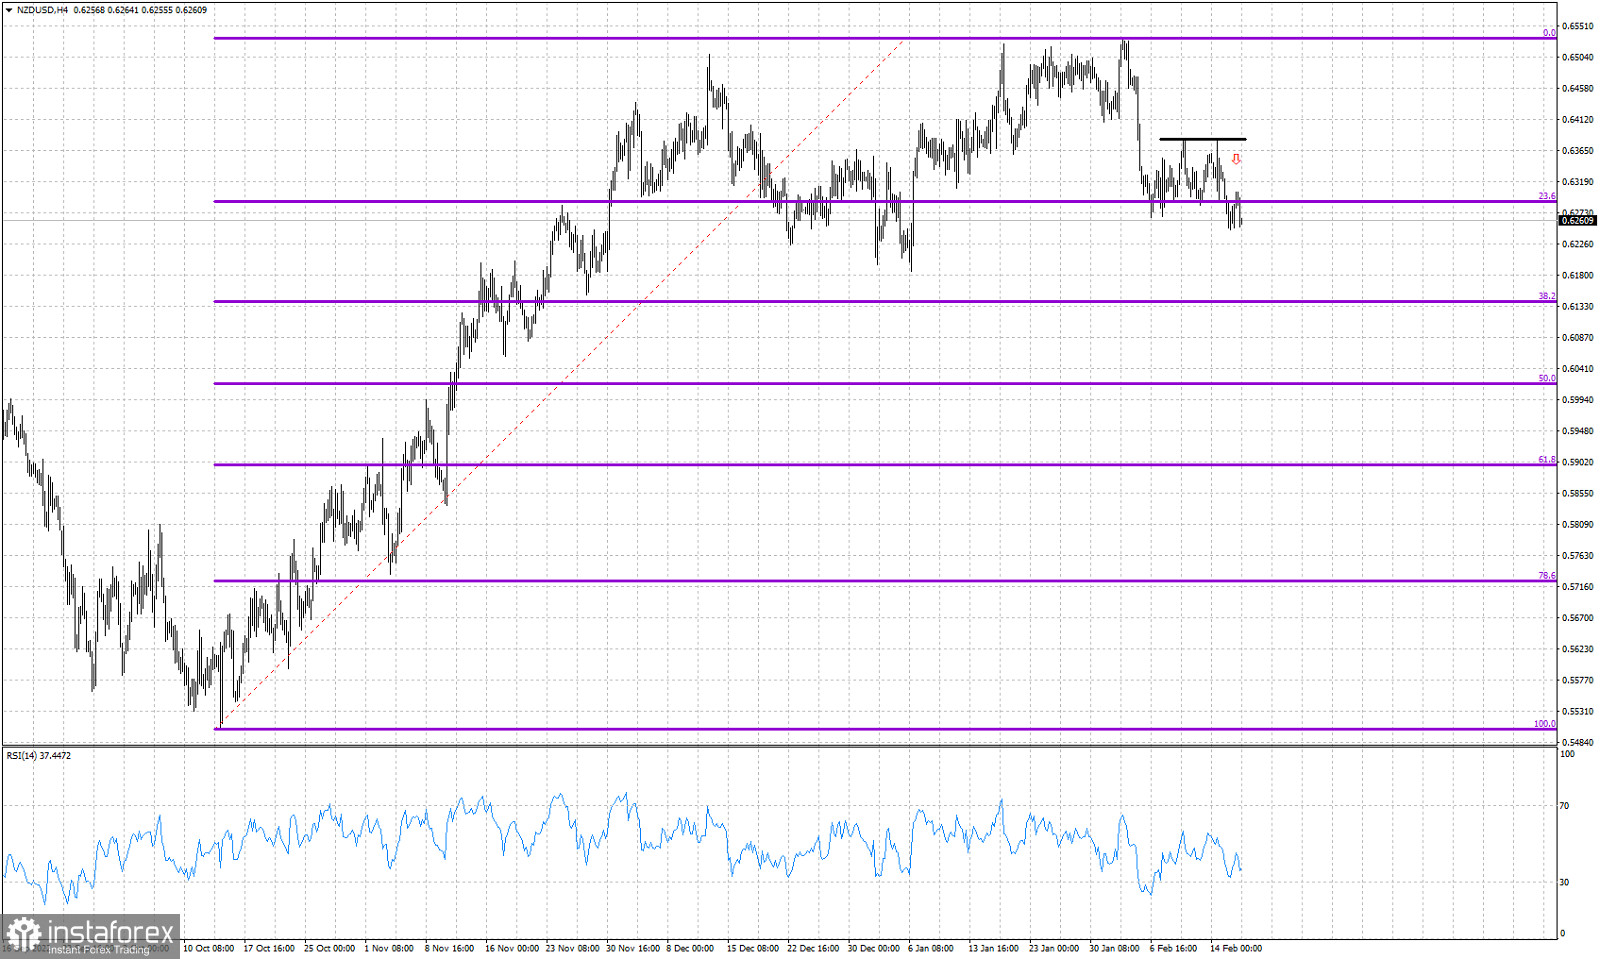
Violet lines - Fibonacci retracements
Black line -resistance
NZDUSD is vulnerable to a move lower towards the 38% Fibonacci retracement at 0.6140. Short-term trend is bearish as price has started making lower lows and lower highs. Recently traders attempted to push price above 0.6380 but instead a double top was formed and price got rejected. Short-term support is at 0.6245 and next at 0.62. As long as price is below 0.6380 we remain pessimistic expecting a move towards the next Fibonacci support level. The RSI has bounced off oversold levels and provided a first bullish divergence. The bullish divergence is not a reversal signal but only a warning. Bulls need to recapture 0.6380 in order to regain control of the trend.