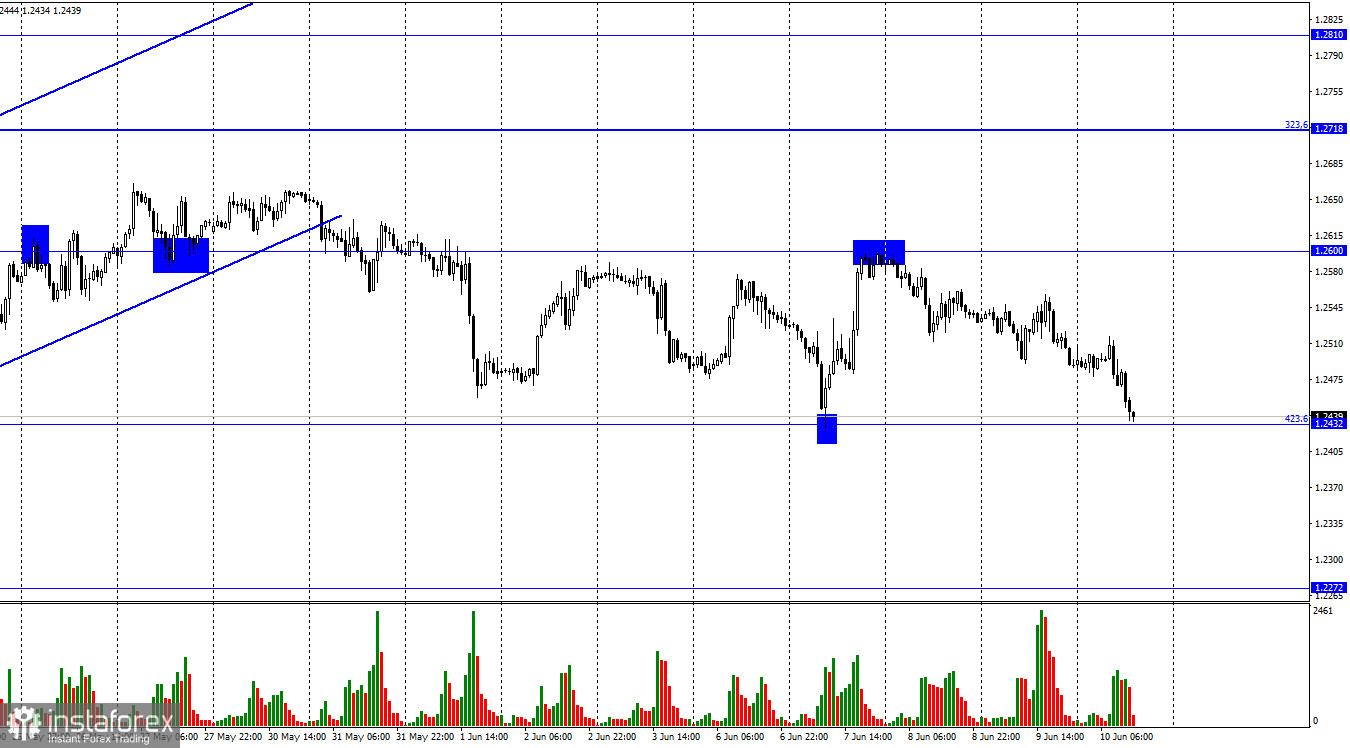
Greetings, dear traders! On the hourly chart, the GBP/USD pair kept declining on Thursday to the Fibonacci correction level of 423.6% - 1.2432. Today, it reached this level. A bounce from this level may lead to an upward reversal to the 1.2600 level. As a reminder, in the last 8 days, the pair has been trading solely between these levels. If the pair drops below the level of 423.6%, the likelihood of a further fall to 1.2272 will increase. The euro is weak due to the ECB meeting results although its downward movement and the meeting results do not coincide at all. The reasons for a drop in the pound sterling were unclear. However, now, it is quite logical. The pound sterling is down as it is moving in the sideways channel. The pair has already fallen to its lower borer of this channel. Thus, traders are hardly surprised.
However, the fact is that the euro and the pound sterling show a similar dynamic again. Yet, there are some bearish factors for the euro, whereas the pound sterling has none. The economy calendar for the UK remains empty on Thursday or Friday. The US will unveil the inflation report soon. I believe that the figure is likely to rise higher. Some FOMC policymakers said last week that inflation has not reached its peak yet. The more time passes, the higher the probability that inflation will still start to decline. The figure is projected to total 8.3% in annual terms. If the reading exceeds to forecast, the Fed may take more aggressive measures to tame inflation in the near future. The US dollar is likely to advance if consumer prices advance again. To start an upward movement, the pound sterling needs to close below the level of 1.2432.

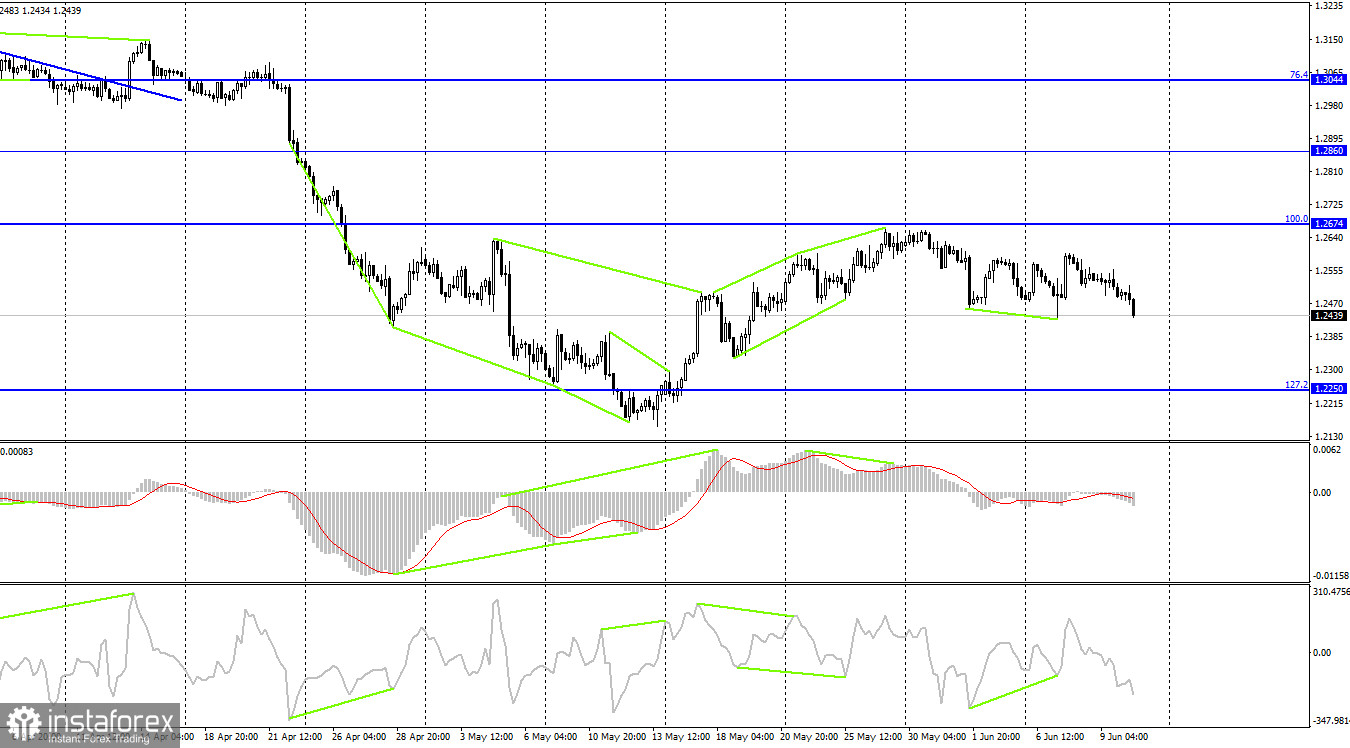
On the 4H chart, the pair make a downward reversal. I draw attention to the fact that the sideways channel on the hourly chart is of great importance now. The price may rebound from its lower border. On the 4-hour chart, a fall over the next week or two to the Fibonacci correction level of 127.2% - 1.2250 looks more likely. No divergences have been seen in any indicator today.
Commitments of Traders (COT):

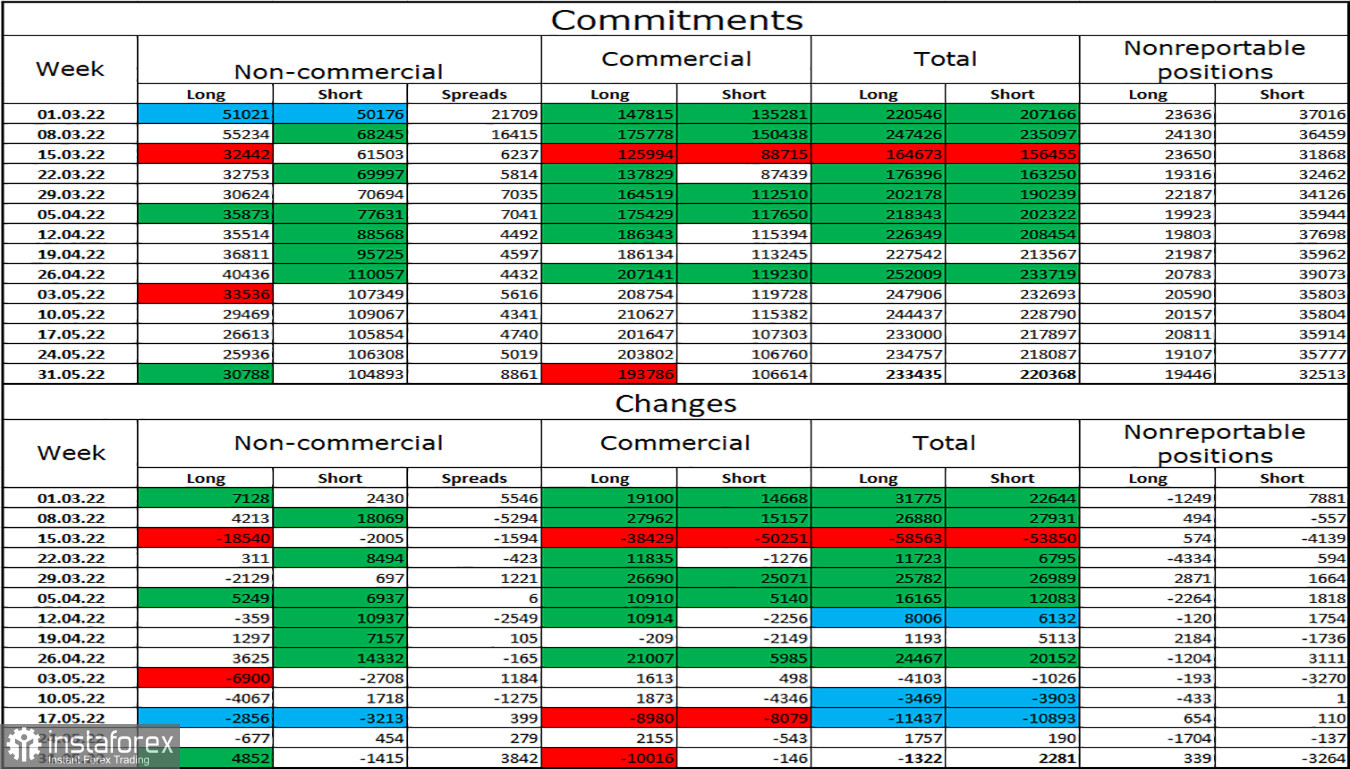
The mood of the "Non-commercial" category of traders has become a little more bullish over the past week. The number of Long contracts increased by 4,852, while the number of Short contracts declined by 1415. Thus, the mood of large traders remained bearish. The number of Long contracts exceeds the number of Short contracts by three times. Speculators continue to get rid of the pound sterling and their mood has not changed much lately. So I think the pound sterling could resume its decline over the next few weeks. Now, the price channels on the 1H and 4H charts will be of great importance as such a big difference between the numbers of Long and Short contracts may also indicate a trend reversal. However, now, traders are more inclined to sell than buy.
Macroeconomic calendars for US and UK:
US – CPI Index (12:30 UTC).
US – University of Michigan Consumer Sentiment Index (14:00 UTC).
On Friday, the economic calendar for the UK is uneventful. Traders are anticipating the US inflation report. In the afternoon, fundamental factors may have a big impact on market sentiment.
Outlook for GBP/USD and trading recommendations:
It is better to open short positions if the price closes below the level of 423.6% - 1.2432 on the hourly chart with a downward target of 1.2272. It is recommended to open long positions if the price rebounds from the level of 1.2432 with an upward target of 1.2600.
 English
 Русский
 Bahasa Indonesia
 Bahasa Malay
 ไทย
ไทย Español
 Deutsch
 Български
 Français
 Tiếng Việt
 中文
中文 বাংলা
বাংলা हिन्दी
 Čeština
 Українська
 Română

