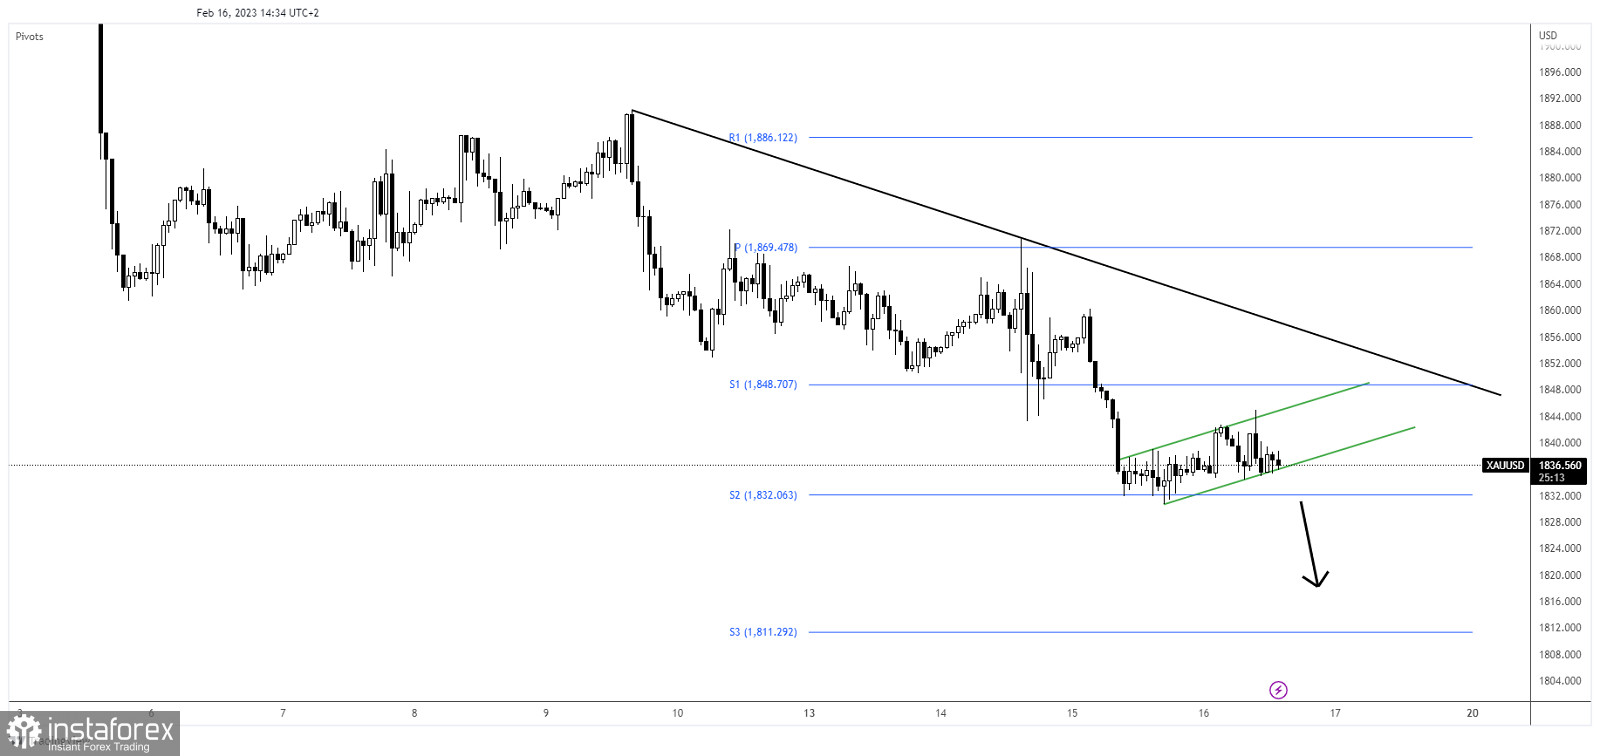
The price of gold rebounded a little in the short term but the downside pressure remains high as the Dollar Index maintains a bullish bias. Later, the US data could be decisive in the short term. XAU/USD is trading at 1,837 at the time of writing.
The US PPI is expected to report a 0.4% growth while Core PPI may register a 0.3% growth. In addition, the Unemployment Claims indicator is expected at 200K in the last week. Positive US figures should lift the greenback and could force the yellow metal to drop.
XAU/USD Flag Formation!

As you can see on the h1 chart, the instrument found support on the weekly S1 of 1,832 and now it has turned to the upside. The price action developed a flag pattern which could announce a downside continuation.
Technically, the weekly S1 (1,848) and the black downtrend line represent strong upside obstacles.
XAU/USD Forecast!
Taking out the flag's support and making a valid breakdown below the weekly S2 (1,832) is seen as a selling opportunity.
 English
 Русский
 Bahasa Indonesia
 Bahasa Malay
 ไทย
ไทย Español
 Deutsch
 Български
 Français
 Tiếng Việt
 中文
中文 বাংলা
বাংলা हिन्दी
 Čeština
 Українська
 Română

