In today's article on the USD/JPY currency pair, we will briefly touch on macroeconomic indicators from the Land of the Rising Sun, and also note the next comments of the head of the Bank of Japan Haruhiko Kuroda, after which we will take a closer look at the technical picture of the dollar/yen currency pair.
So, last night the final data on Japan's GDP for the first quarter were published, which turned out to be stronger than forecast values. Despite expectations that the quarterly GDP will be at the level of minus 0.3%, the actual figure was minus 0.1%. In annual terms, this important indicator also turned out to be better than the forecast of minus 1% and amounted to minus 0.5%. However, as has been repeatedly emphasized in many previous articles on USD/JPY, this currency pair reacts very poorly to Japanese statistics, which cannot be said about American macroeconomic reports, especially when they are of increased importance. Today's statistics from the United States will be presented with data on initial applications for unemployment benefits, which will be published at 13:30 London time.
If we turn to the position of the Bank of Japan, it remains unchanged, namely, it has a pronounced "dovish" character. In particular, the head of the Japanese Central Bank Kuroda reiterated that his department will continue to support the national economy by maintaining a soft monetary policy. The main motive for such actions of the Japanese Central Bank is the stable and sustainable achievement of the 2% inflation target. At the same time, the head of the BoJ believes that the current jump in inflation is caused by rising energy prices and will not be sustainable. Well, let's see, while the prices for and do not think to decline, but on the contrary, continue their growth.
Well, it's time to move on to the consideration of the technical picture, and for completeness, understanding it, I suggest starting a technical analysis of USD/JPY with a weekly timeframe.
Weekly

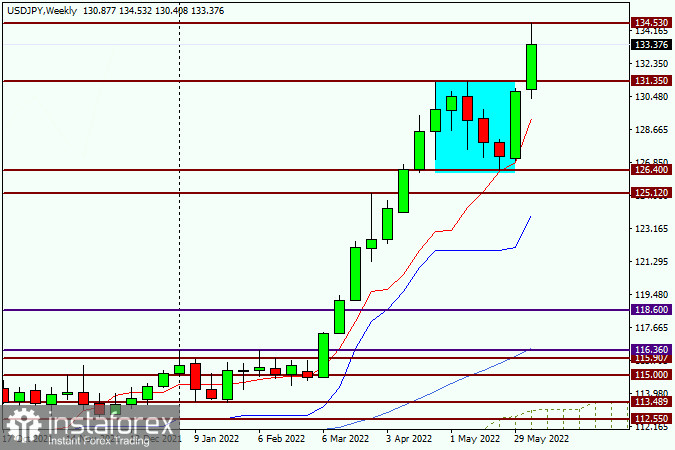
Last week, the dollar/yen pair showed impressive growth, which not only continues at the current five-day auction but also becomes even stronger. Thus, the assumption made earlier about a possible change in the bullish trend has not been confirmed. As can be seen on the chart, it was just a technical correction. At the moment, the dollar/yen pair is breaking through the strong resistance of sellers at 131.35 and is already trading near 133.33. Attempts to go up this strong technical mark of 134.00 have not been successful the first time. As you can see, having shown the maximum values at 134.53, the pair has moved to a pullback and, at the moment, the current weekly candle already has a rather big upper shadow. In general, such high prices have not been observed for this trading instrument for a long time. Whether it will still be. Looking at this chart, purchases naturally suggest themselves, but buying here and now would be a bit risky. The ideal option would be a rollback to the broken resistance of sellers 131.35. However, whether such a rollback will be given, and when it is completely unclear. I will only note that closing the week above 134.00 will further indicate the already strong bullish sentiment for this currency pair.
Daily

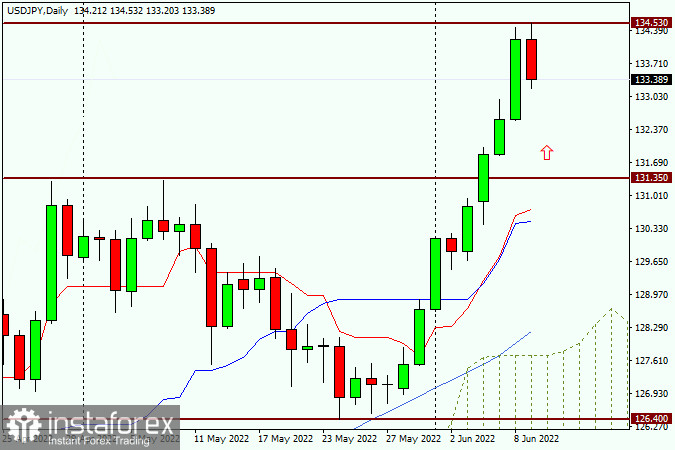
Looking at the daily chart, the consolidation of the quote, which took place in the period from April 28 to June 3, is particularly visible. And so, as recently as the day before yesterday, the pair broke out of a fairly wide range of 131.35-126.40 and rushed up. Thus, we can come to an unequivocal opinion that the upward trend in the USD/JPY currency pair is not only preserved but has also gained a second wind. I would like to note that after such long-term consolidations, this is quite a common and natural phenomenon. Naturally, in the current realities, the main trading recommendation is purchases. However, to open long positions, it is safest to wait for a corrective pullback. Do not try to jump into the outgoing train on the move, it can be fraught with unpleasant consequences. I suggest that to open long positions, wait for corrective pullbacks to the levels of 133.00 and (or) 132.50, and if there are confirming candle signals on this or smaller charts, open buy deals.
 English
 Русский
 Bahasa Indonesia
 Bahasa Malay
 ไทย
ไทย Español
 Deutsch
 Български
 Français
 Tiếng Việt
 中文
中文 বাংলা
বাংলা हिन्दी
 Čeština
 Українська
 Română

