Analysis of EUR/USD, M5 chart

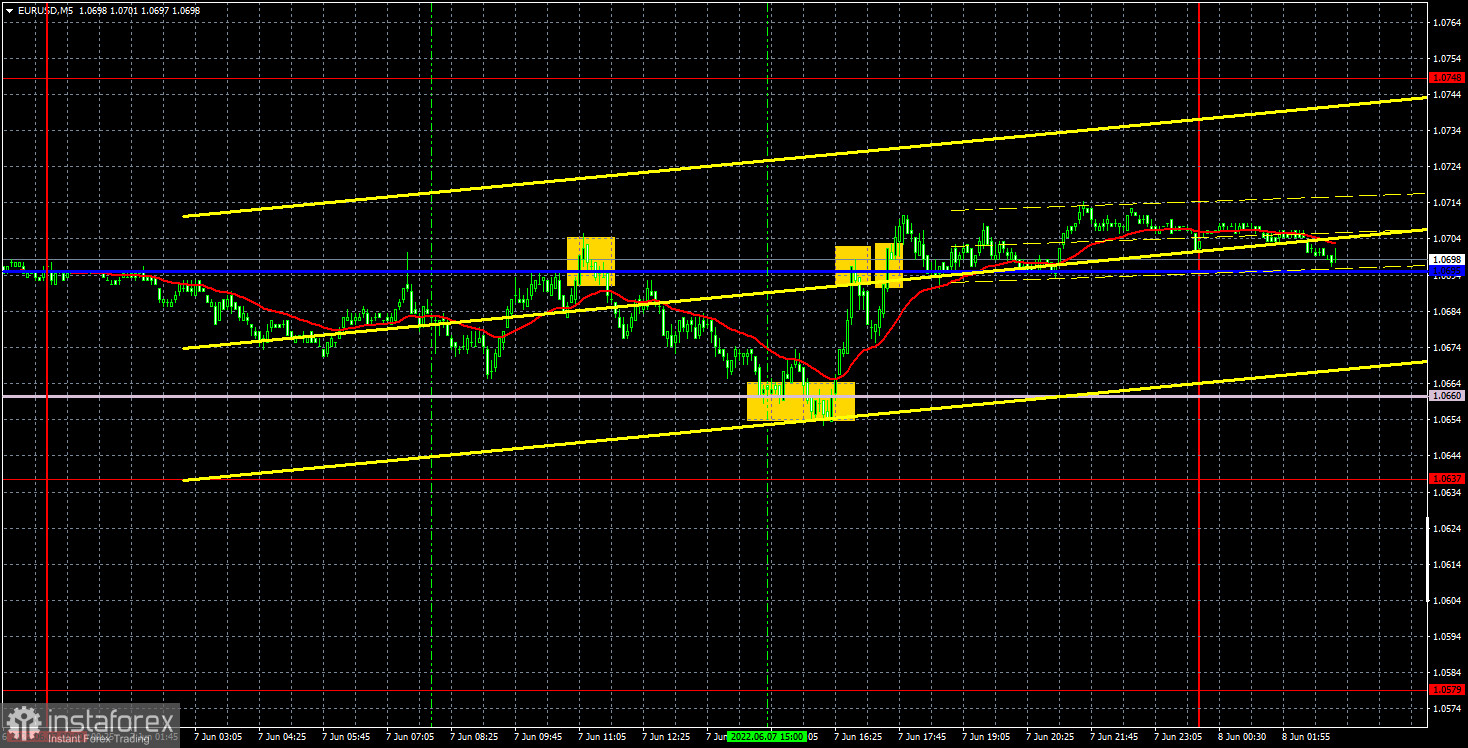
On Tuesday, the EUR/USD tarded mixed, rising and falling alternately. According to the 1-hour time frame, market swings have been observed in the past one and a half weeks. It explains the pair's yesterday movement. In the first half of the day, the price was in a downtrend. During the North American session, however, a bullish reversal occurred and the quote soared. Technically, the pair tested both lines of the Ichimoku indicator. The price may ignore these lines or does it already, which is common for a flat. After all, the Ichimoku is a trend indicator. Moreover, no macro events unfolded on Tuesday, so traders had nothing to react to.
Naturally, trading signals were rather weak. The price rebounded from the Kijun-sen line and the Senkou Span B line, and then it made two inaccurate signals near Kijun-sen. As a result, there were four signals created that could be tested. However, in the recent articles, we regularly draw the attention of traders to the pair's no-trend movement. Good signals are sometimes produced even during a flat, sometimes not. Therefore, the first two signals could have been tested as they could have brought some 30-40 pips of profit. The last two trading signals could have been ignored after the pair's unexpected growth by 45 pips in half an hour. Volatility seemed to be low, but the pair still showed some movement.
COT report:

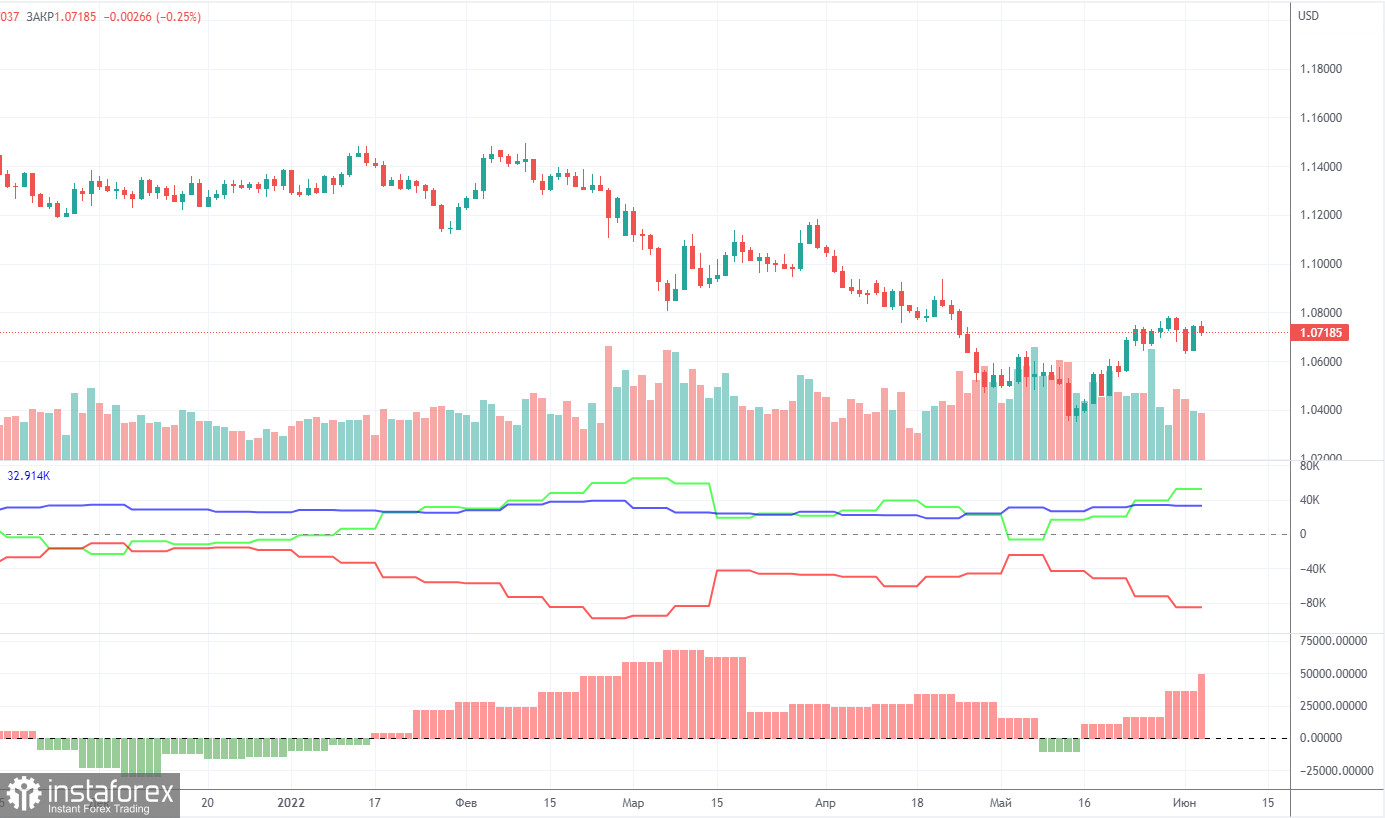
The latest COT reports raised a lot of questions. Although they showed bullish sentiment among professional players in the past few months, the euro remained bearish all the time. The situation has now started to change because the euro began to grow. That is, sentiment remains bullish, according to the COT report, but the euro goes up because it needs to retrace up once in a while. At the same time, sentiment has been bullish for quite some time, while the euro has barely gained 400 pips over the last few weeks. During the reporting week, Non-commercial traders closed 500 long positions and 13,800 short ones. The net position grew by 14,200 in a week. The number of longs exceeds the number of shorts by 50,000 in the group of non-commercial traders because demand for the US dollar remains much higher than for the euro. Although the euro has stilled briefly, this does not mean that the global downtrend will not resume tomorrow and the COT results will not continue to contradict the actual state of the market. In other words, COT data is now unreliable.
Analysis of EUR/USD, H1 chart

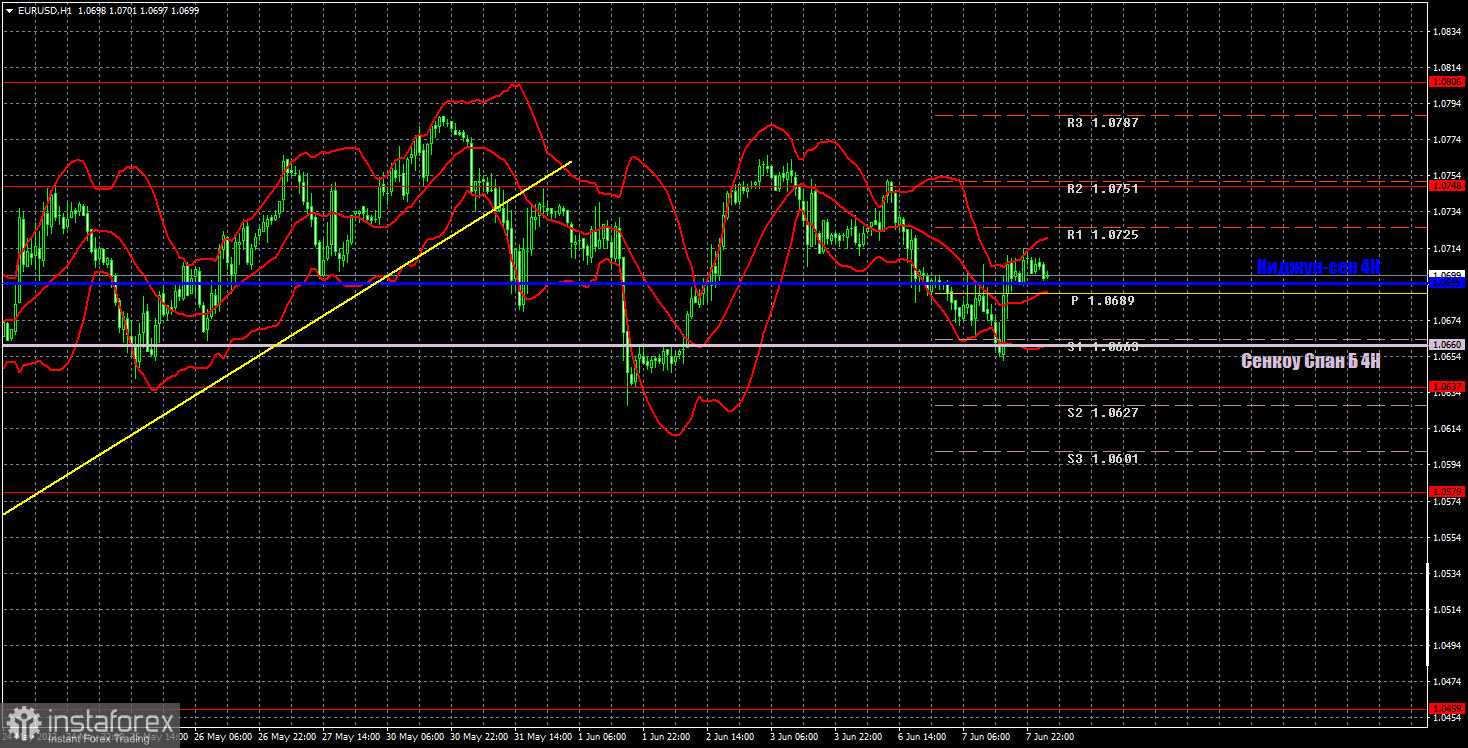
In the hourly time frame, the pair is currently either trying to start a new downtrend or to somehow maintain the uptrend. The fact is that the price can test neither the latest swing high nor the latest swing low. In recent weeks, market swings have been observed. They usually occur when traders are not sure of where to go, so they create false signals. On Wednesday, the targets are seen at 1.0459, 1.0579, 1.0637, 1.0748, and 1.0806 as well as the Senkou Span B (1.0660) and Kijun-sen (1.0695) lines. Ichimoku lines can move during the day, which should be taken into account when looking for trading signals. There are also additional support and resistance levels, but no signals are made near them. Signals could be produced after rebounds and breakouts of extreme levels and lines. Do not forget about placing a Stop Loss order at the breakeven point if the price goes in the right direction by 15 pips. The order can help minimize losses in case of false signals. The third Q1 GDP estimates will be released in the eurozone on June 8. However, it is unlikely to trigger market jitters, so the market's reaction will not follow. The United States will see no important releases during the day.
Indicators on charts:
Resistance and support are thick red lines, near which the trend may stop. They do not make trading signals.
The Kijun-sen and Senkou Span B lines are the Ichimoku indicator lines moved to the hourly timeframe from the 4-hour timeframe. They are also strong lines.
Extreme levels are thin red lines, from which the price used to bounce earlier. They can produce trading signals.
Yellow lines are trend lines, trend channels, and any other technical patterns.
Indicator 1 on the COT charts is the size of the net position of each trader category.
Indicator 2 on the COT charts is the size of the net position for the Non-commercial group of traders.
 English
 Русский
 Bahasa Indonesia
 Bahasa Malay
 ไทย
ไทย Español
 Deutsch
 Български
 Français
 Tiếng Việt
 中文
中文 বাংলা
বাংলা हिन्दी
 Čeština
 Українська
 Română

