Analyzing trades on Thursday:
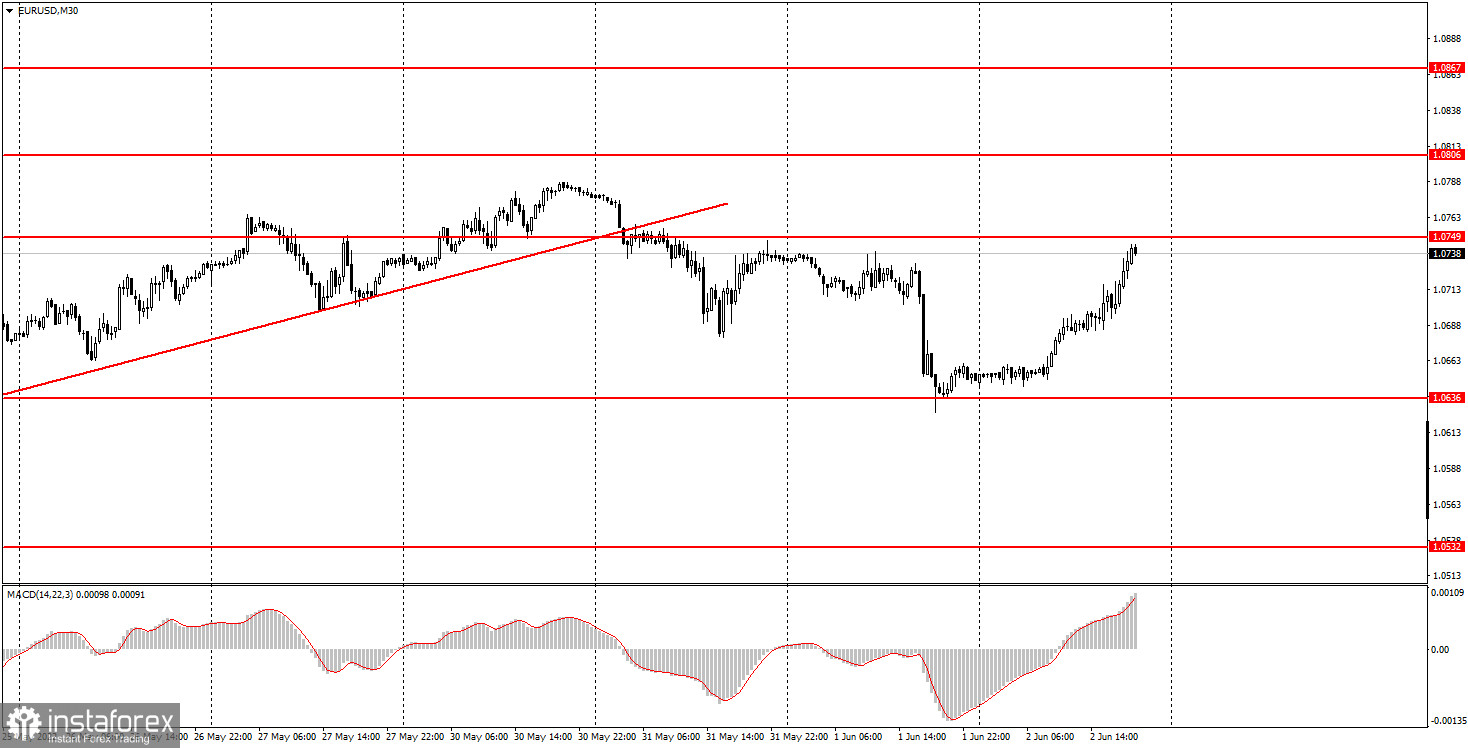
EUR/USD on 30M chart

On Thursday, EUR/USD managed to win back all the losses from Wednesday. The pair moved upwards right after it failed to break through the level of 1.0636. At the moment of writing, the price was approaching the level of 1.0749, located very close to the local highs. So, at the moment, the euro is more likely to start an uptrend or a flat movement. On Thursday, the euro was growing throughout the day even though there were no important reports in the morning. This means that there were no conditions for buying the euro, at least in the early session. In the afternoon, the ADP report on the number of jobs in the private sector was published in the US. The data turned out to be twice as worse as expected which is why a new decline in the US dollar was quite natural. However, I still think that it was the technical factor that actually mattered. We still cannot confirm a downtrend as the pair has failed to break through the level of 1.0636, and there is no sense in forming a trendline based on just 2-3 days of observation.
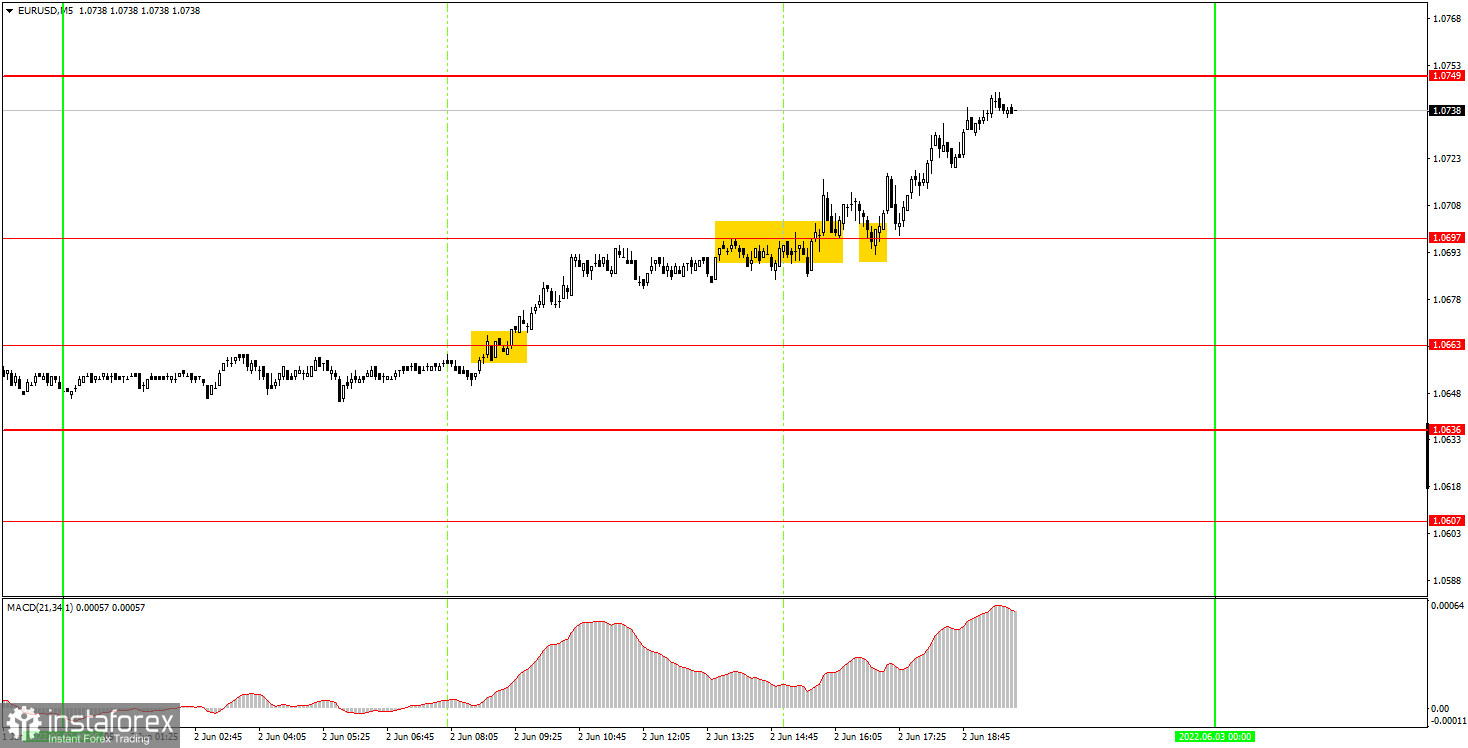
EUR/USD on 5M chart

On the 5-minute time frame, the technical picture looked almost perfect. In the European and American sessions, the pair was slowly moving in an uptrend in one direction, which made trading nice and easy. The first buy signal was formed at the very beginning of the European session when the price broke through the level of 1.0663. So, beginners should have opened long positions at this point. Later, the pair broke through the level of 1.0697 and hit 1.0749 by the end of the day. Traders needed to close this position manually as soon as the price had tested this level as it was already late in the day. So, one single trade could have brought beginners a profit of 70 pips, which is a great result. It is such a pleasure to trade when the pair is moving within a trend.
Trading tips on Friday
On the 30-minute time frame, the ascending trendline is no longer relevant. At the same time, the current situation suggests that the uptrend may resume. If the pair manages to overcome the level of 1.0749 on Friday, the euro may form a new upward cycle. If the price rebounds from 1.0749, then the pair may return to the level of 1.0636. On the 5-minute chart on Friday, it is recommended to trade at the levels of 1.0607, 1.0636, 1.0663, 1.0697, 1.0749, 1.0787-1.0806, and 1.0837. Set a Stop Loss to breakeven as soon as the price goes 15 pips in the right direction. On Friday, the EU will publish the data on business activity in the service sector and the report on retail sales for April. Although this data is watched by the market, it is unlikely to affect the trajectory of the pair. The US is due to release a much more important report. Novice traders should focus on the Nonfarm Payrolls report, the key publication on Friday. In the afternoon, we expect to see some volatile movements in all the pairs with the US dollar.
Basic rules of the trading system
1) The strength of the signal is determined by the time it took the signal to form (a rebound or a breakout of the level). The quicker it is formed, the stronger the signal is.
2) If two or more positions were opened near a certain level based on a false signal (which did not trigger a Take Profit or test the nearest target level), then all subsequent signals at this level should be ignored.
3) When trading flat, a pair can form multiple false signals or not form them at all. In any case, it is better to stop trading at the first sign of a flat movement
4) Trades should be opened in the period between the start of the European session and the middle of the US trading hours when all positions must be closed manually.
5) You can trade using signals from the MACD indicator on the 30-minute time frame only amid strong volatility and a clear trend that should be confirmed by a trendline or a trend channel.
6) If two levels are located too close to each other (from 5 to 15 pips), they should be considered support and resistance levels.
On the chart
Support and Resistance levels are the levels that serve as targets when buying or selling the pair. You can place Take Profit near these levels.
Red lines are channels or trend lines that display the current trend and show in which direction it is better to trade now.
The MACD indicator (14, 22, and 3) consists of a histogram and a signal line. When they cross, this is a signal to enter the market. It is recommended to use this indicator in combination with trend patterns (channels and trendlines).
Important announcements and economic reports that can be found on the economic calendar can seriously influence the trajectory of a currency pair. Therefore, at the time of their release, we recommend trading as carefully as possible or exiting the market in order to avoid sharp price fluctuations.
Beginners on Forex should remember that not every single trade has to be profitable. The development of a clear strategy and money management is the key to success in trading over a long period of time.
 English
 Русский
 Bahasa Indonesia
 Bahasa Malay
 ไทย
ไทย Español
 Deutsch
 Български
 Français
 Tiếng Việt
 中文
中文 বাংলা
বাংলা हिन्दी
 Čeština
 Українська
 Română

