 English
  Русский
 Bahasa Indonesia
 Bahasa Malay
 ไทย
ไทย Español
 Deutsch
 Български
 Français
 Tiếng Việt
 中文
中文 বাংলা
বাংলা हिन्दी
 Čeština
 Українська
 Română

Trend analysis (fig. 1).
Today, the pair may retreat from the level of 1.0732 (the closing of yesterday's daily candlestick) to the target level of 1.0708. This is the support level (the white bold line). After testing this level, the price is likely to grow to the target level of 1.0797, the Fibonacci retracement level of 76.4% (red dotted line). If this scenario comes true, the pair is likely to continue its upward movement.
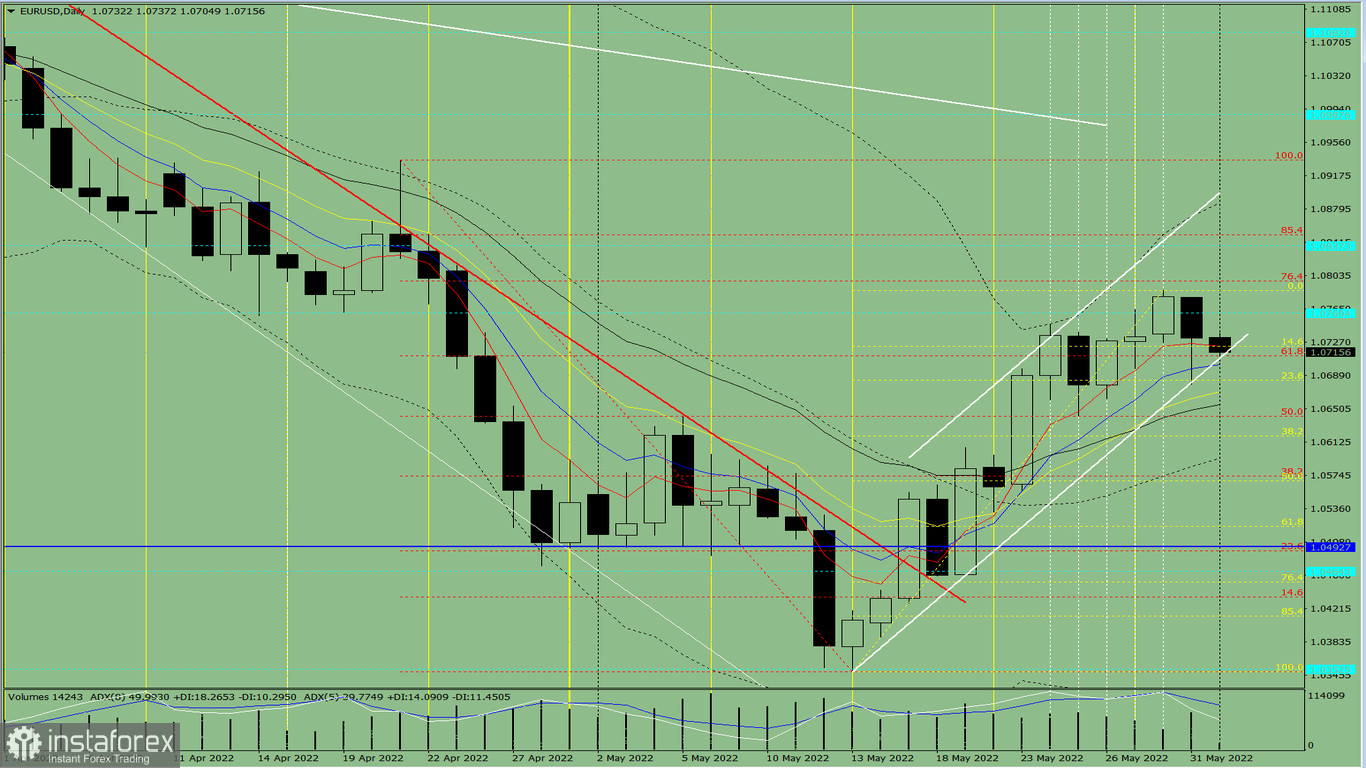
Fig. 1 (daily chart).
The complex analysis:
-indicator analysis– down;- Fibonacci retracement levels – down;- trading volumes – down;- candlestick analysis – down;- trend analysis – up;- Bollinger lines – up;- weekly chart-up.
Conclusion
Today, the pair may retreat from the level of 1.0732 (the closing of yesterday's daily candlestick) to the target level of 1.0708. This is the support level (the white bold line). After testing this level, the price is likely to grow to the target level of 1.0797, the Fibonacci retracement level of 76.4% (red dotted line). If this scenario comes true, the pair is likely to continue its upward movement.
Alternatively, the pair may drop from the level of 1.0732 (the closing of yesterday's daily candlestick) to the target level of 1.0679. This is the Fibonacci retracement level of 23.6% (yellow dotted line). After testing this level, the price is likely to advance to the target level of 1.0786, which is the upper fractal (yellow dotted line).