Technical outlook:
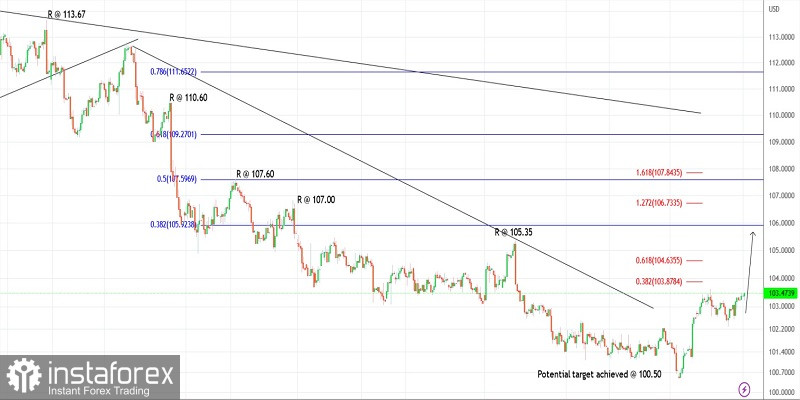
The US dollar index is testing the last week's high at 103.60. If successful, the price could rally towards 104.00 and 104.60 levels in the near term. On the flip side, if 103.60 holds well, the index would drop below 102.00 to complete a flat structure before resuming higher again. The index is trading close to 103.35 at this point in writing as the price is getting ready for a pullback lower.
The overall wave structure is indicating that US dollar index is heading towards 106.50 and up to 109.50 in the next few weeks. The bulls might have managed to complete the first wave higher towards 103.60. Prices might drop below 102.00 as the second wave unfolds before rallying towards 106.50 as third wave progresses.
The US dollar index is looking set to push towards the 109.00-50 levels thereafter. Please note that the 109.00-50 zone is the Fibonacci 0.618 retracement of the entire drop between 114.70 and 100.50. Hence, a probability remains high for the bears to come back in control if prices are able to reach there. The instrument is looking higher from here.
Trading idea:
Potential rally against 100.00
Good luck!
 English
 Русский
 Bahasa Indonesia
 Bahasa Malay
 ไทย
ไทย Español
 Deutsch
 Български
 Français
 Tiếng Việt
 中文
中文 বাংলা
বাংলা हिन्दी
 Čeština
 Українська
 Română

