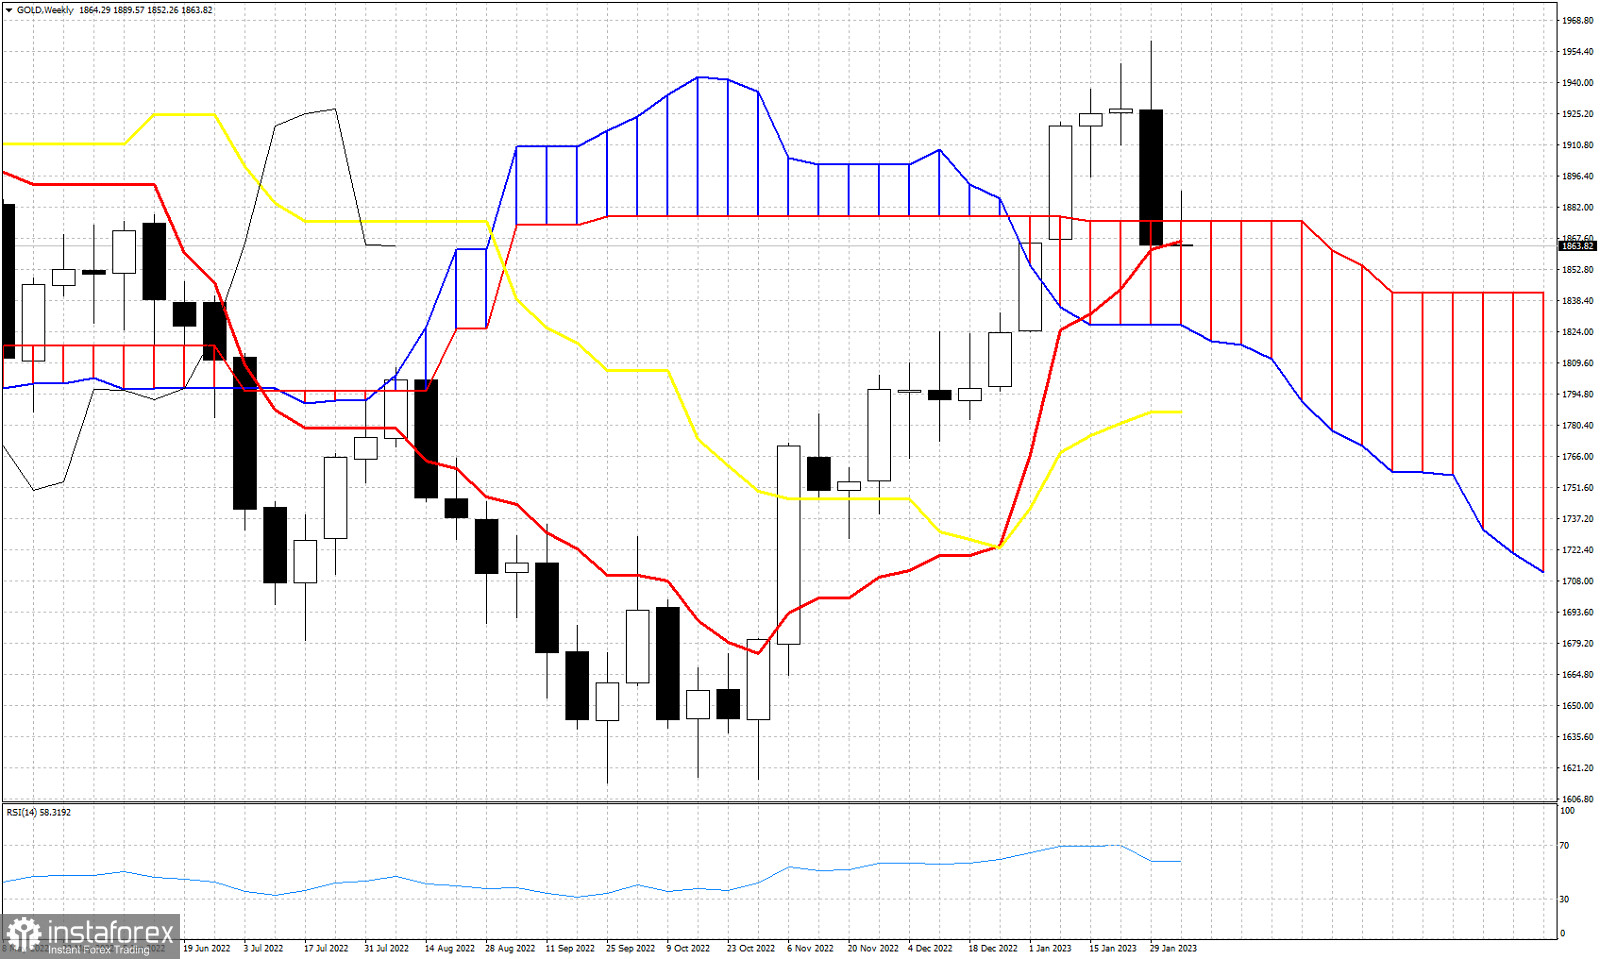
Gold price closed the week near the weekly low of $1,852. The weekly candlestick has a long upper tail. This is a sign of weakness. In Ichimoku cloud terms weekly trend has turned to neutral as price has entered the Kumo (cloud). This week price also closed the below the tenkan-sen (red line indicator). This is another sign of weakness. Next weekly support is the lower cloud boundary at $1,827. As long as price is below $1,875, Gold price is vulnerable of testing the kijun-sen (yellow line indicator) at $1,786. On a weekly basis Gold price is vulnerable to more downside.
 English
 Русский
 Bahasa Indonesia
 Bahasa Malay
 ไทย
ไทย Español
 Deutsch
 Български
 Français
 Tiếng Việt
 中文
中文 বাংলা
বাংলা हिन्दी
 Čeština
 Українська
 Română

