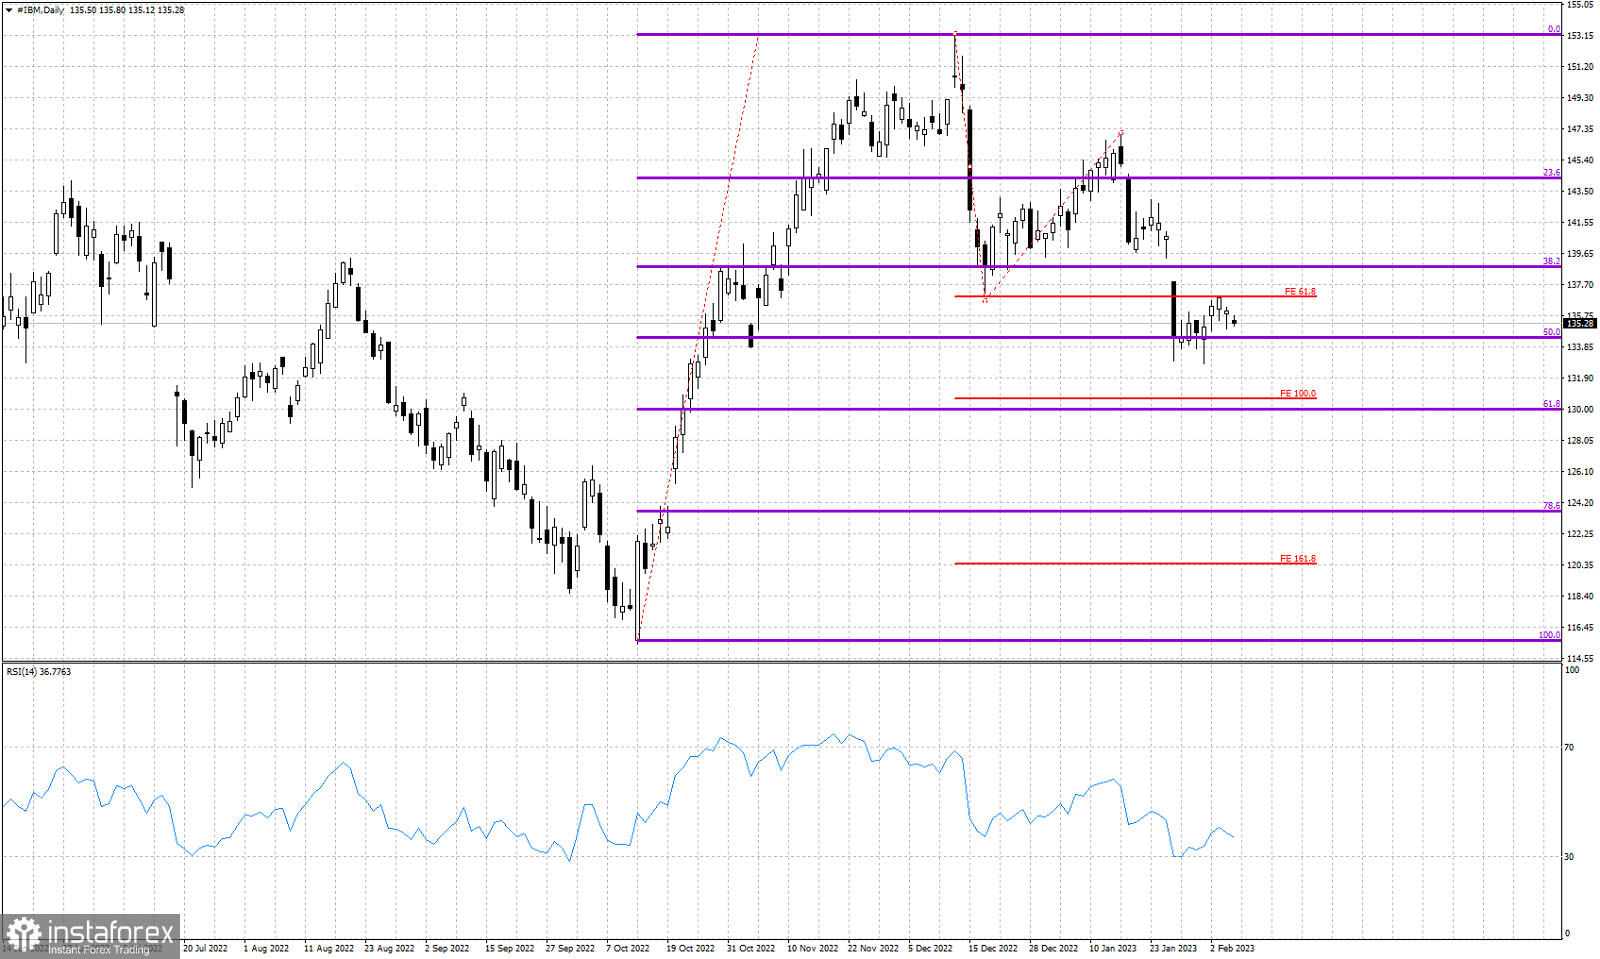
Violet lines- Fibonacci retracements
Red lines- Fibonacci extensions
IBM stock price is trading around $135.25 forming lower lows and lower highs since the top at $153.14. Short-term trend us bearish as price has already retraced 50% of the entire rise from $115.4. IBM stock price formed a lower high at $147.13 and is under pressure since then. A new lower low is expected. Short-term support is found at $133.80 and a daily close below this level will open the way for a move towards the 61.8% retracement where we also find the 100% Fibonacci extension target of the first leg down.
 English
 Русский
 Bahasa Indonesia
 Bahasa Malay
 ไทย
ไทย Español
 Deutsch
 Български
 Français
 Tiếng Việt
 中文
中文 বাংলা
বাংলা हिन्दी
 Čeština
 Українська
 Română

