Technical Market Outlook:
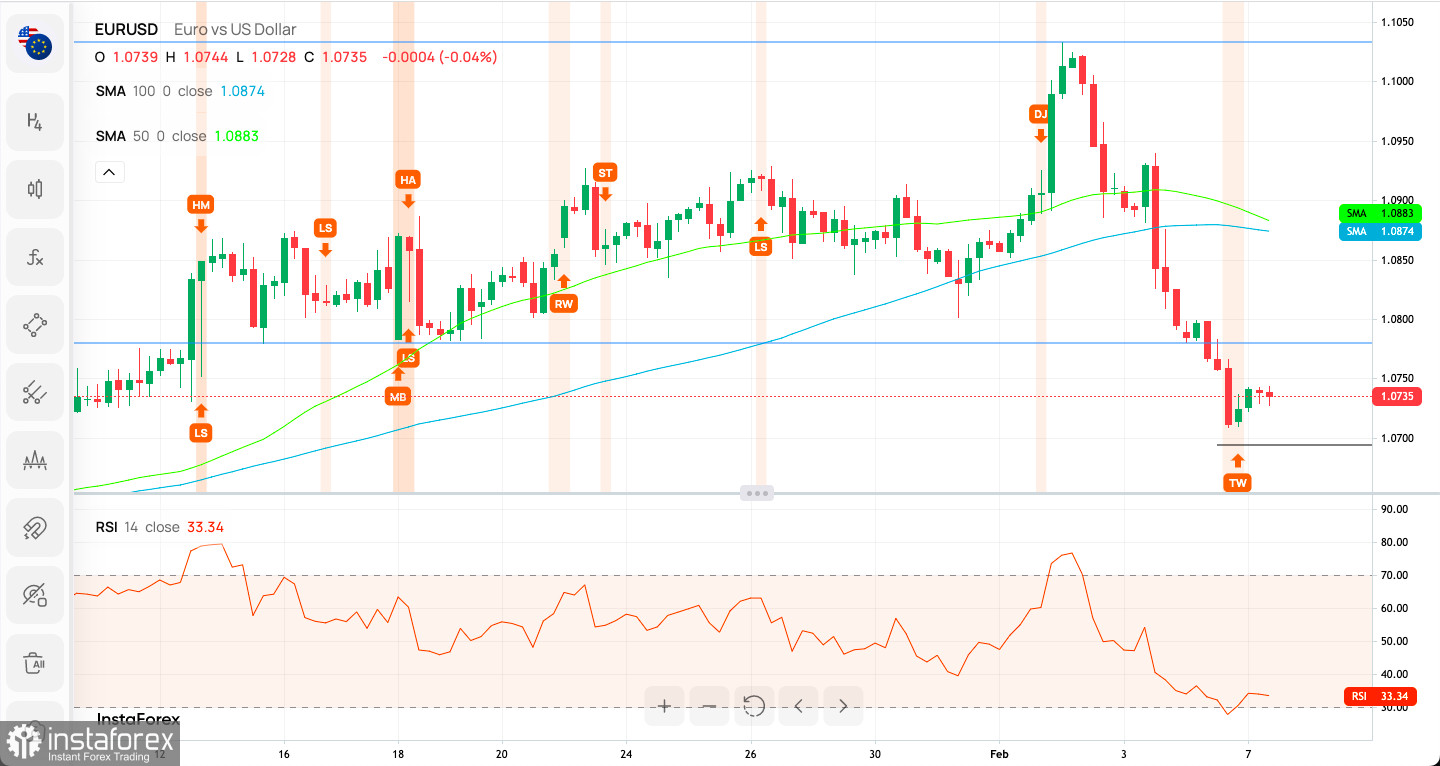
The EUR/USD pair had made Tweezer Bottom candlestick pattern on H4 time frame chart, so a potential bounce/reversal is on table now. The bears had broken below the key short-term technical support seen at the level of 1.0785 - 1.0803 and this zone will now act as technical resistance. The 50% Fibonacci retracement level seen at 1.0760 was violated as well and 61% Fibonacci retracement level is seen at 1.0694. The weak and negative momentum on the H4 time frame chart supports the negative outlook for EUR.

Weekly Pivot Points:
WR3 - 1.08070
WR2 - 1.08006
WR1 - 1.07971
Weekly Pivot - 1.07942
WS1 - 1.07907
WS2 - 1.07878
WS3 - 1.07814
Trading Outlook:
Since the beginning of October 2022 the EUR/USD is in the corrective cycle to the upside, but the main, long-term trend remains bearish. This corrective cycle might had been terminated at the level of 1.1033 which is 50% Fibonacci retracement level. The EUR had made a new multi-decade low at the level of 0.9538, so as long as the USD is being bought all across the board, the down trend will continue towards the new lows.
 English
 Русский
 Bahasa Indonesia
 Bahasa Malay
 ไทย
ไทย Español
 Deutsch
 Български
 Français
 Tiếng Việt
 中文
中文 বাংলা
বাংলা हिन्दी
 Čeština
 Українська
 Română

