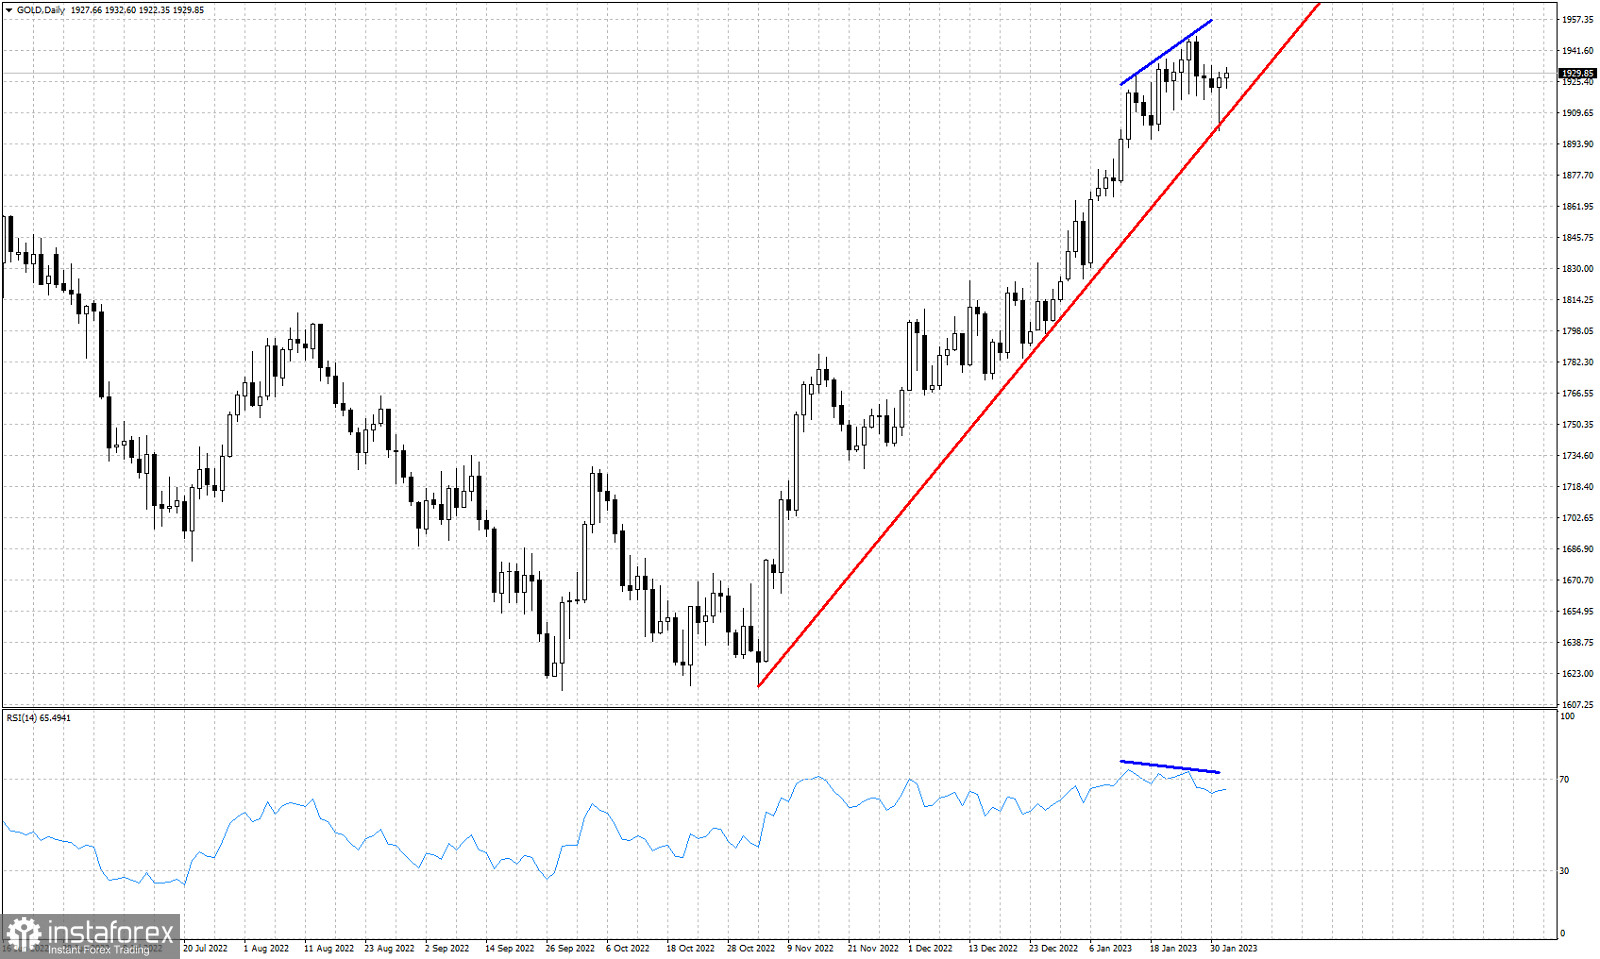
Red line- support
Blue lines- bearish RSI divergence
Gold price is trading around $1,930. Price remains technically in an up trend making higher highs and higher lows. The upward sloping support trend line as shown in the Daily chart, remains intact. Price tested the support trend line for another time yesterday and bulls managed to defend it. The RSI continues to diverge but so far price has not provided us with the necessary break down to confirm a reversal. It is very likely to see a trend reversal soon, but so far bulls remain in control of the trend. Support at $1,900-$1,920 remains key. After yesterday's test of this support area, the importance of it has increased.
 English
 Русский
 Bahasa Indonesia
 Bahasa Malay
 ไทย
ไทย Español
 Deutsch
 Български
 Français
 Tiếng Việt
 中文
中文 বাংলা
বাংলা हिन्दी
 Čeština
 Українська
 Română

