Technical outlook:
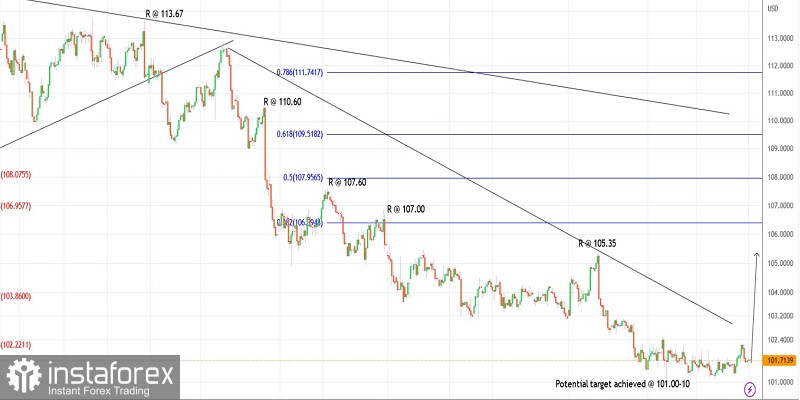
The US dollar index dropped through the 101.65 low during the early Asian session on Wednesday, testing the 101.63 lows earlier. The pullback was expected and projected with a potential support zone defined as 101.60-70 earlier. Also, note that prices peaked through 102.20-30 before turning lower to produce a meaningful retracement. The near targets are 102.50 and above 103.00.
The US dollar index terminated its larger-degree decline, which started from 114.70 earlier, around 101.10 as seen on the 4H chart here. The lower-degree waves seem to be working on the higher side and a sharp rally could be expected from here with 101.25 support intact. The bulls will remain inclined to target 105.35, which serves as strong resistance.
The US dollar index might be preparing to retrace its entire drop between 114.70 and 101.00 in the next few weeks. The potential upside targets are 106.50 and up to 109.50. Also, note that 109.50 is the Fibonacci 0.618 retracement of the entire drop between 114.70 and 101.00. So, a high probability remains for a bearish turn if prices reach there.
Trading idea:
Potential rally against 100.00
Good luck!
 English
 Русский
 Bahasa Indonesia
 Bahasa Malay
 ไทย
ไทย Español
 Deutsch
 Български
 Français
 Tiếng Việt
 中文
中文 বাংলা
বাংলা हिन्दी
 Čeština
 Українська
 Română

