Technical Market Outlook:
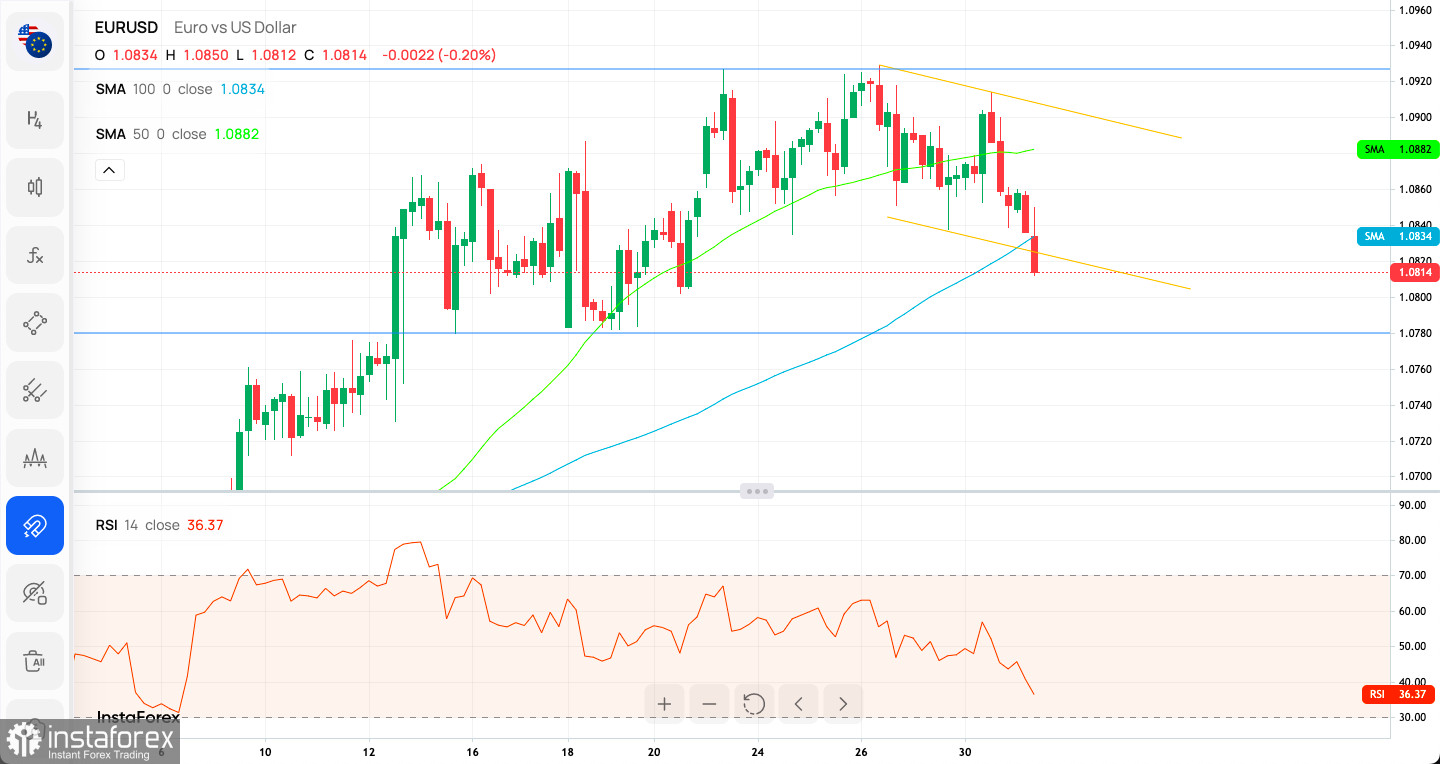
After the EUR/USD pair has made a new local high at the level of 1.0929, the market has been consolidating for a few days in a tight range located between the levels of 1.0838 - 1.0920. The bulls missed 16 pips the 50% Fibonacci retracement level (1.0945) of the last big wave down. The bulls are still trying to move higher, however, there is a clear Bearish Divergence on the H4 time frame chart between the price and the momentum oscillator, so the short-term outlook is still bearish. The breakout from the descending channel might accelerate the down wave towards the intraday technical support seen at the level of 1.0780 and below.

Weekly Pivot Points:
WR3 - 1.09496
WR2 - 1.09130
WR1 - 1.09001
Weekly Pivot - 1.08764
WS1 - 1.08635
WS2 - 1.08398
WS3 - 1.08032
Trading Outlook:
Since the beginning of October 2022 the EUR/USD is in the corrective cycle to the upside, but the main, long-term trend remains bearish. The EUR had made a new multi-decade low at the level of 0.9538, so as long as the USD is being bought all across the board, the down trend will continue towards the new lows. In the mid-term, the key Fibonacci retracement level is located at 1.0945 (50% Fibonacci retracement) and only if this level is clearly violated, the down trend might be considered terminated.
 English
 Русский
 Bahasa Indonesia
 Bahasa Malay
 ไทย
ไทย Español
 Deutsch
 Български
 Français
 Tiếng Việt
 中文
中文 বাংলা
বাংলা हिन्दी
 Čeština
 Українська
 Română

