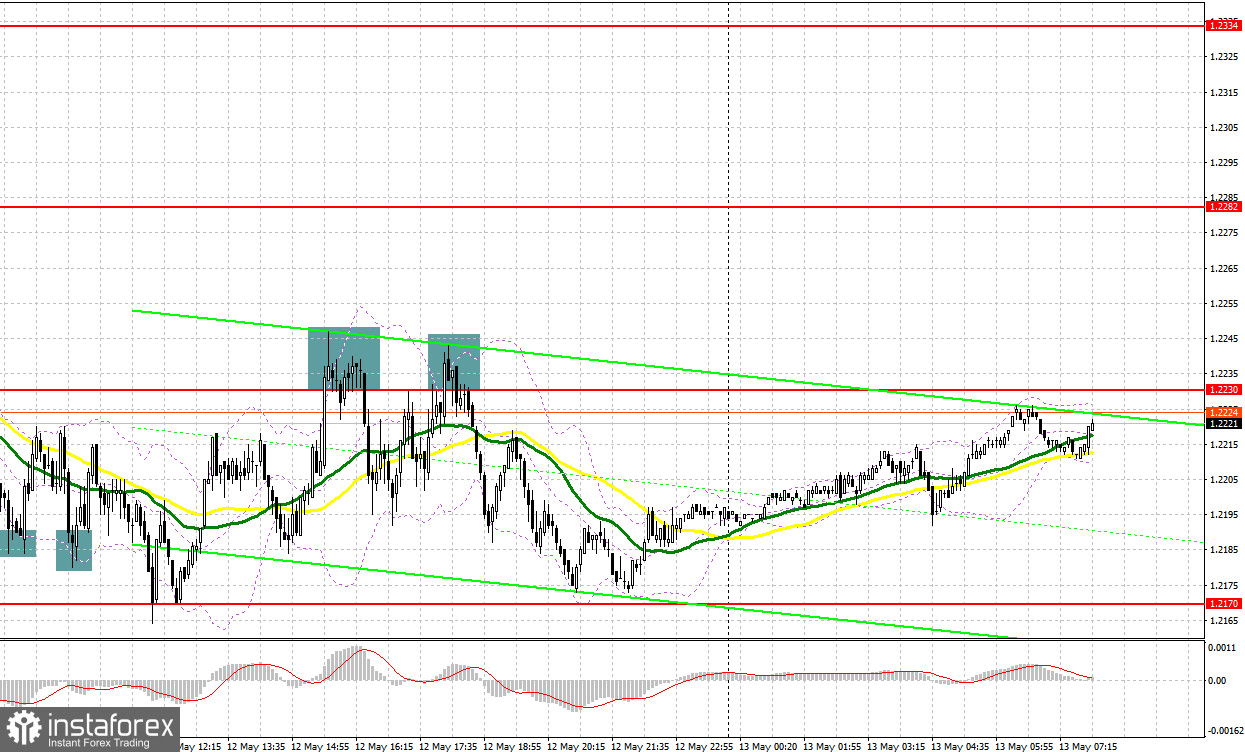
Yesterday, there were plenty of gainful entry points. Let's look at the 5-minute chart and try to figure out what actually happened. In the morning article, I highlighted the level of 1.2185 and recommended making decisions with this level in focus. The pound sterling sharply declined to the support level of 1.2185 in the morning due to discouraging economic data. A false breakout of this level and a buy signal took place shortly after. As a result, the pound/dollar pair rose by about 30 pips. After that, bears tried to push the pair below 1.2185 but failed again. As a result, there was a similar false breakout and a buy signal. The pair climbed by about 25 pips. Only the third attempt was successful. The price dropped below 1.2185. However, at that moment this level was no longer important for traders. In the afternoon, the pair tried to climb above 1.2230. Yet, it was unable to. There were two attempts, which gave an excellent sell signal. They brought 30-40 pips.

What is needed to open long positions on GBP/USD
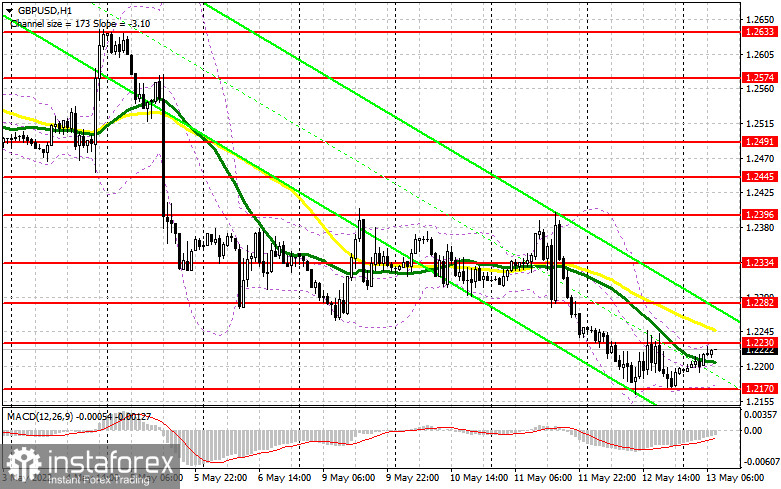
As for technical indicators, the outlook remains the same for the first half of the day. The economic calendar for the UK is uneventful today. It may help the pound sterling start an upward correction. The chances are quite high as bulls managed to withstand the bearish pressure after the disappointing economic report. Gross domestic product fell by 0.1% in March 2022, after no growth in February 2022 It means that the economy expanded by only 0.8% in the first quarter, undershooting economists' forecasts. They had expected at least a 1% increase. Today, it is better to focus on the nearest support level of 1.2170. Bulls need to defend this level at all costs. If the pound sterling falls, a false breakout of this level may generate a buy signal with a prospect of an upward correction. The quotes may advance to the resistance level of 1.2230. There could be a sharp upward reversal as the macroeconomic calendar is empty today. Bears may start locking in profits by the end of the week. Consolidation above 1.2230 with a downward test will give a buy signal. The pair is likely to rise to 1.2282. The moving averages are passing in the negative zone at this level. For this reason, I recommend profit-taking. The more distant target level will be 1.2334. However, it is hard to imagine what should happen so that such a scenario could come true. In case of a further decline in the pound sterling and the absence of bulls at 1.2170, the pair is likely to fall to yearly lows. We should also expect a sell-off near the level of 1.2122. I also advise you to enter the market at this level only if there is a false breakout. You can buy GBP/USD immediately on a rebound from the low of 1.2074 or even a lower low around 1.2030, keeping in mind an upward intraday correction of 30-35 pips.
What is needed to open short positions on GBP/USD
Bears continue to hold the upper hand. Nevertheless, yesterday, they failed to push the pair below 1.2170. It signals the possibility of a correction at the end of the week. Today, bears need to protect 1.2230. A downward movement is likely to persist as long as the pair is trading below this range. In the case of a drastic rise, only a false breakout of 1.2230 may give a sell signal. The pair could also slip 1.2170. A breakout and an upward test of this level could generate an additional sell signal. As a result, the pound sterling may tumble to a new low of 1.2122. I recommend locking in profits at this level. A more distant target level will be 1.2074. This scenario may come true only in the afternoon amid strong US macro stats and FOMC members' speeches. If the pair grows and bears show no energy at 1.2230, there could be an upward reversal against the background of a sharp drop in stop-loss orders. If so, it is better to cancel short positions until the resistance level of 1.2282. I also advise you to open short positions there only in case of a false breakout. You can sell GBP/USD immediately for a rebound from 1.2334, keeping in mind a downward intraday correction of 30-35 pips.

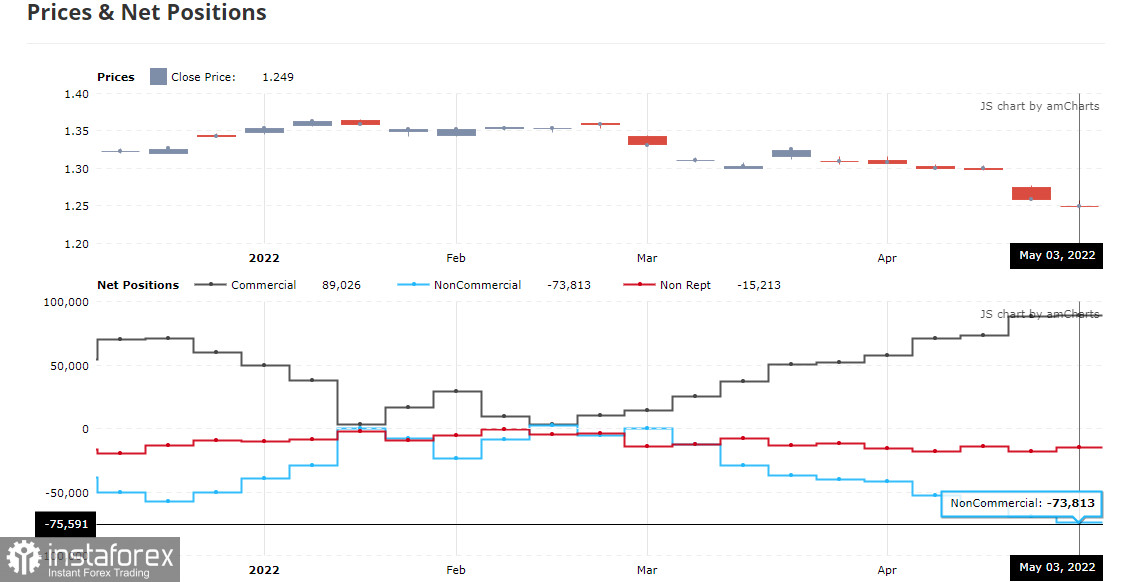
The COT report (Commitment of Traders) for May 3 logged recorded a contraction in both short and long positions. However, a decline in short ones was rather modest, which led to an increase in the negative delta. Investors are now rather cautious when it comes to opening positions on GBP. The UK economy is going through hard times. Inflation is soaring, fueling the cost of living. Besides, the prospects of the pound sterling are rather vague. The US dollar is now strong and more reliable thanks to the Fed's hawkish stance on monetary policy. It is extremely bearish for the pound sterling. Analysts believe that in case of a slight decrease in inflationary pressure in the US, the British currency may begin an upward correction. The Bank of England hiked the key rate but it did not bring any results. The regulator is cautious and in no hurry to take drastic measures amid surging inflation. The BoE Governor Andrew Bailey also warned about a massive downturn. It means that the economic prospects are rather grim and the pound sterling is unlikely to resume a steady rally. The situation will only worsen as it is quite difficult to access inflation risks due to the geopolitical tensions. However, there is no doubt that the consumer price index will continue to grow in the coming months. The UK labor market, where employers are forced to fight for every employee by offering higher wages, is also pushing inflation higher. The COT report for May 3 revealed that the number of long non-commercial positions decreased by 6,900 to the level of 33,536, while the number of short non-commercial positions dwindled by only 2,708 to the level of 107,349. This led to an increase in the negative value of the non-commercial net position from -69,621 to -73,813. The weekly closing price declined to 1.2490 from 1.2587.

Signals of technical indicators
Moving averages
GBP/USD is trading below 30- and 50-period moving averages. It signals the continuation of the bearish trend.
Remark. The author is analyzing the period and prices of moving averages on the 1-hour chart. So, it differs from the common definition of classic daily moving averages on the daily chart.
Bollinger Bands
In case of a rise, the upper border at 1.2230 will act as resistance. If the pair slides down, the lower border at 1.2170 will act as support.
Definitions of technical indicators
- Moving average recognizes an ongoing trend through leveling out volatility and market noise. A 50-period moving average is plotted yellow on the chart.
- Moving average identifies an ongoing trend through leveling out volatility and market noise. A 30-period moving average is
- displayed as the green line.
- MACD indicator represents a relationship between two moving averages that is a ratio of Moving Average Convergence/Divergence.
- The MACD is calculated by subtracting the 26-period Exponential Moving Average (EMA) from the 12-period EMA. A 9-day EMA of the MACD called the "signal line".
- Bollinger Bands is a momentum indicator. The upper and lower bands are typically 2 standard deviations +/- from a 20-day simple moving
- average.
- Non-commercial traders - speculators such as retail traders, hedge funds, and large institutions who use the futures market for speculative purposes and meet certain requirements.
- Non-commercial long positions represent the total long open position of non-commercial traders.
- Non-commercial short positions represent the total short open position of non-commercial traders.
- The overall non-commercial net position balance is the difference between short and long positions of non-commercial traders.
 English
 Русский
 Bahasa Indonesia
 Bahasa Malay
 ไทย
ไทย Español
 Deutsch
 Български
 Français
 Tiếng Việt
 中文
中文 বাংলা
বাংলা हिन्दी
 Čeština
 Українська
 Română

