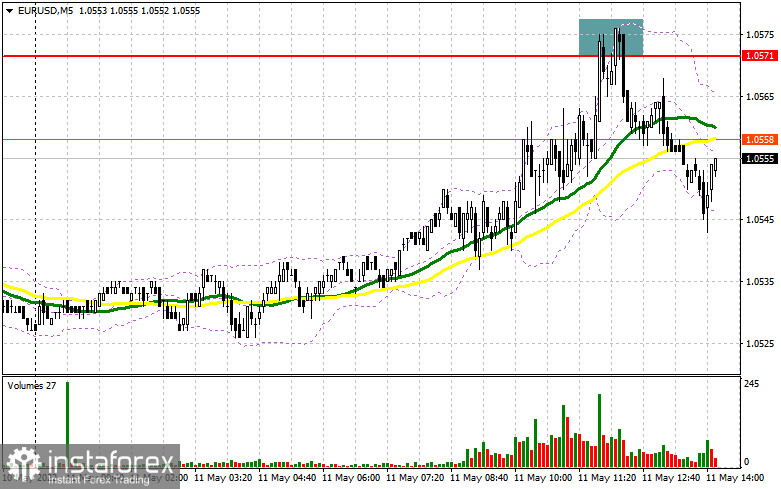
In my morning forecast, I paid attention to the 1.0571 level and recommended making decisions on entering the market from it. Let's look at the 5-minute chart and figure out what happened there. The released report on inflation in Germany fully coincided with the forecasts of economists, to which the euro reacted with growth. As a result, we received an unsuccessful attempt to grow above 1.0571 and a false breakdown. According to the morning scenario, all this allowed me to increase short positions from the upper border of the side channel, which I took advantage of. At the time of writing, the downward movement has already amounted to more than 30 points. From a technical point of view, nothing has changed for the second half of the day, nor has the strategy changed. And what were the entry points for the pound this morning?

To open long positions on EURUSD, you need:
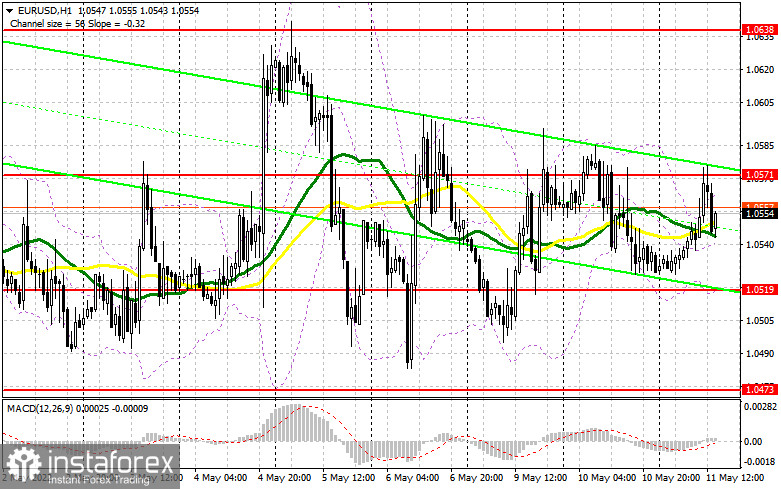
All attention will now be focused on inflation data in the US, on which the further direction of the pair depends. In the event of a decrease in price pressure, as economists expect, the demand for risky assets will increase, which will lead to an upward movement of EUR/USD and a re-growth in the area of 1.0571. If the situation turns out to be not as favorable as many expect, the pressure on the euro will return, because the US dollar will continue to strengthen its position with increased price pressure, which will force the Federal Reserve System to act more aggressively - even an increase in interest rates by 0.75% immediately in June this year is not excluded. The formation of a false breakdown at 1.0519 will give a good entry point into long positions in the expectation of a return of the initiative by buyers, followed by growth and a breakdown of 1.0571. Going beyond this range can also occur in the case of rather passive performances by FOMC members. Rafael Bostic will deliver a speech immediately after the publication of the report on the consumer price index in the United States, excluding food and energy prices. A breakout and a top-down test of 1.0571 form a new signal for entering long positions, strengthening buyers, and opening up the opportunity for further growth of EUR/USD to the area of 1.0638, where I recommend fixing the profits. A more distant target will be the 1.0691 area. In the event of a decline in EUR/USD and the absence of buyers at 1.0519, the optimal scenario for buying will be a false breakdown near this year's low of 1.0473. I advise you to open long positions on the euro immediately for a rebound only from 1.0426, or even lower - around 1.0394 with the aim of an upward correction of 30-35 points inside the day.
To open short positions on EURUSD, you need:
Sellers coped with the task and defended 1.0571. While trading will be conducted below this range, we can expect continued pressure on the euro and another attempt to break through the middle of the side channel. As I noted above, everything will depend on the CPI index data for April this year. The optimal scenario for opening short positions will be the next formation of a false breakdown in the area of 1.0571, but for this, you need to return to this level. A breakdown and consolidation below 1.0519 will be a more likely option for sale. Together with the reverse test from the bottom up, this will give an excellent signal to open additional short positions, which will lead to the demolition of several bulls' stop orders and to the return of the bearish trend with the prospect of updating 1.0473, where I recommend fixing the profits. A more distant target will be the 1.0426 area, but such a scenario is possible only after the complete capitulation of euro buyers. If EUR/USD rises during the US session and there are no bears at 1.0571, serious problems will begin. In this case, I expect a sharper uptrend, as the breakout of this range will hit several stop orders of traders counting on the preservation of the bearish trend. The optimal scenario will be short positions when forming a false breakdown in the area of 1.0638. You can sell EUR/USD immediately on a rebound from 1.0691, or even higher - around 1.0736 with the aim of a downward correction of 25-30 points.

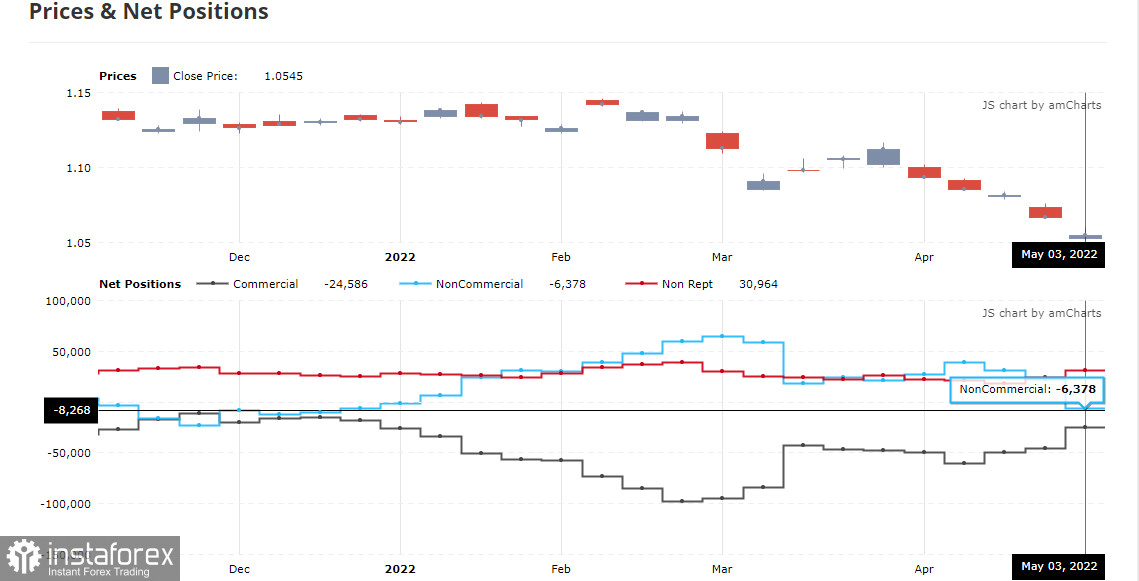
The COT report (Commitment of Traders) for May 3 recorded a sharp increase in short positions and a reduction in long ones. Recent statements by representatives of central banks have led to a new active sale of risky assets, as it is obvious to everyone that serious problems in the economies of developed countries cannot be avoided this year. A sharp increase in interest rates in the US by 0.5% at once also makes investors look at the US dollar as a safe-haven asset. High inflation is a problem not only in the US, but also around the world, and the active tightening of monetary policy by the US central bank makes the dollar a more attractive asset. The President of the European Central Bank in her speeches has also repeatedly noted the need for more active policy changes. It is expected that the bond purchase program will be completed by the end of the second quarter of this year, and the first-rate increase will occur in the fall of this year. While the ECB is planning, the Fed is acting. Hence the attractiveness of the dollar. Much will depend on American inflation and market reaction. In case of a slight decrease this week, the pressure on the euro will weaken, which will lead to the strengthening of risky assets and will allow for the formation of a small upward correction in EUR/USD. The COT report indicates that long non-profit positions decreased from the level of 221,003 to the level of 208,449, while short non-profit positions increased sharply from the level of 189,702 to the level of 214,827. It is also worth noting that the low exchange rate of the euro makes it more attractive to traders, so even against the background of changes in the balance of power in favor of sellers, this asset remains quite attractive for medium-term investors. At the end of the week, the total non-commercial net position decreased and amounted to -6,378. The weekly closing price collapsed and amounted to 1.0545 against 1.0667.

Signals of indicators:
Moving averages
Trading is conducted around 30 and 50 daily moving averages, which indicates the lateral nature of the market.
Note: The period and prices of moving averages are considered by the author on the hourly chart H1 and differ from the general definition of the classic daily moving averages on the daily chart D1.
Bollinger Bands
In the case of growth, the upper limit of the indicator around 1.0565 will act as resistance. In case of a decline, the lower limit of the indicator in the area of 1.0519 will act as support.
Description of indicators
- Moving average (moving average determines the current trend by smoothing out volatility and noise). Period 50. The graph is marked in yellow.
- Moving average (moving average determines the current trend by smoothing out volatility and noise). Period 30. The graph is marked in green.
- MACD indicator (Moving Average Convergence / Divergence - moving average convergence/divergence) Fast EMA period 12. Slow EMA period 26. SMA period 9
- Bollinger Bands (Bollinger Bands). Period 20
- Non-profit speculative traders, such as individual traders, hedge funds, and large institutions use the futures market for speculative purposes and to meet certain requirements.
- Long non-commercial positions represent the total long open position of non-commercial traders.
- Short non-commercial positions represent the total short open position of non-commercial traders.
- Total non-commercial net position is the difference between the short and long positions of non-commercial traders.
 English
 Русский
 Bahasa Indonesia
 Bahasa Malay
 ไทย
ไทย Español
 Deutsch
 Български
 Français
 Tiếng Việt
 中文
中文 বাংলা
বাংলা हिन्दी
 Čeština
 Українська
 Română

