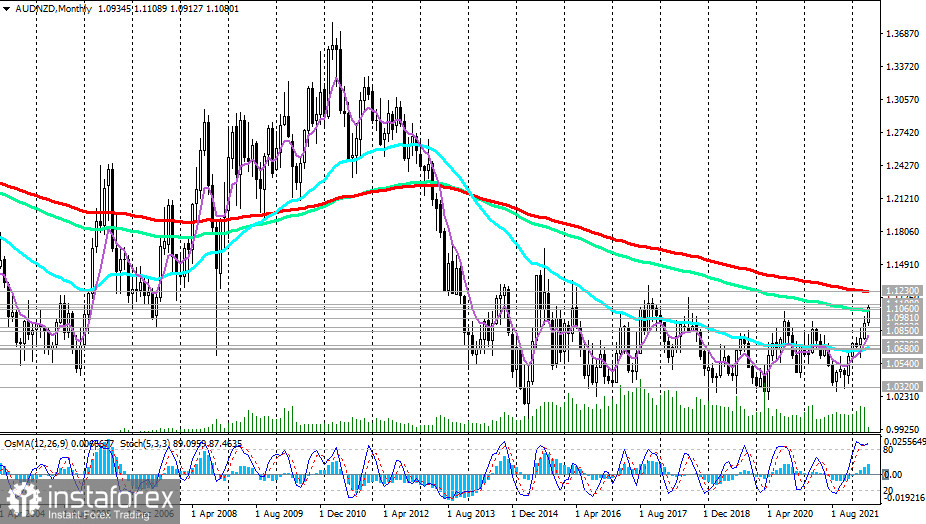
AUD/NZD has been trading in an upward trend since December 2021. After rising from 1.0430, the pair broke through an important resistance level near 1.0540 in mid-December and continued to grow strongly, reaching a local 3.5-year high of 1.1108 this week.
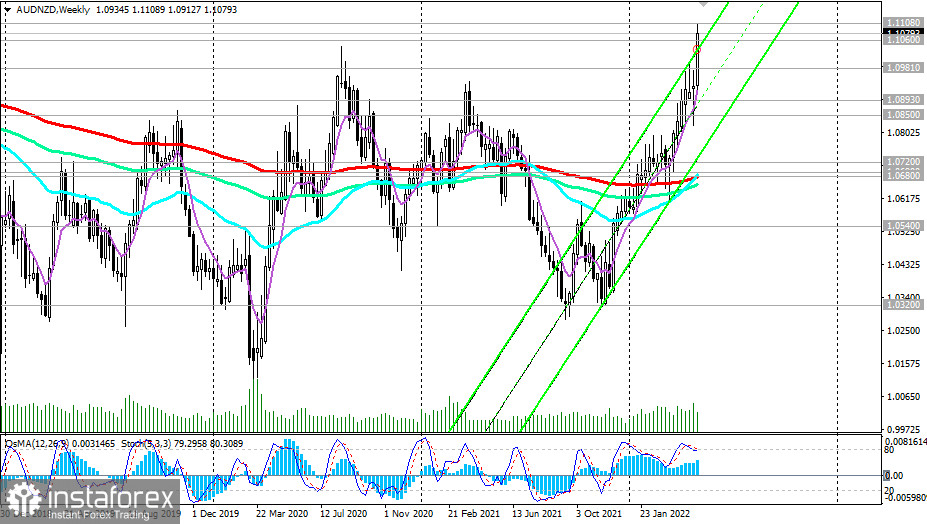
Since December, AUD/NZD has already grown by 6.1% and its positive dynamics continues. Having broken the upper limit of the ascending channel on the weekly chart this week (at 1.1030), AUD/NZD is now testing the important resistance level 1.1060 (144 EMA on the monthly chart) for a breakdown. Consolidation in the area above the resistance level of 1.1230 (200 EMA on the monthly chart) will create prerequisites for this pair to enter the global bull market zone.
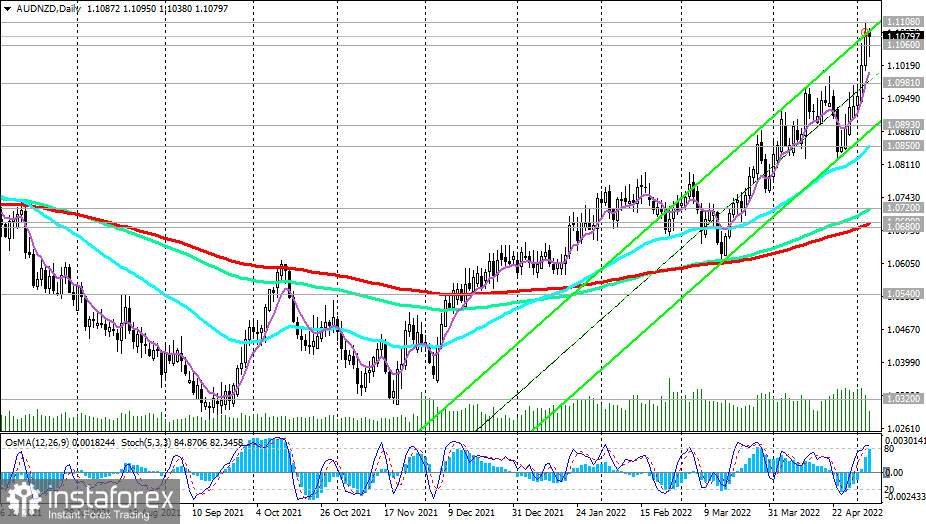
In our previous review of this pair, we have noted that long positions are considered preferable, and the growth targets are the resistance levels of 1.0950 and 1.1040. As you can see, our forecast was completely justified. In case of breakdown of the local resistance level passing through 1.1108, we are waiting for testing of the resistance level near 1.1200, 1.1230.
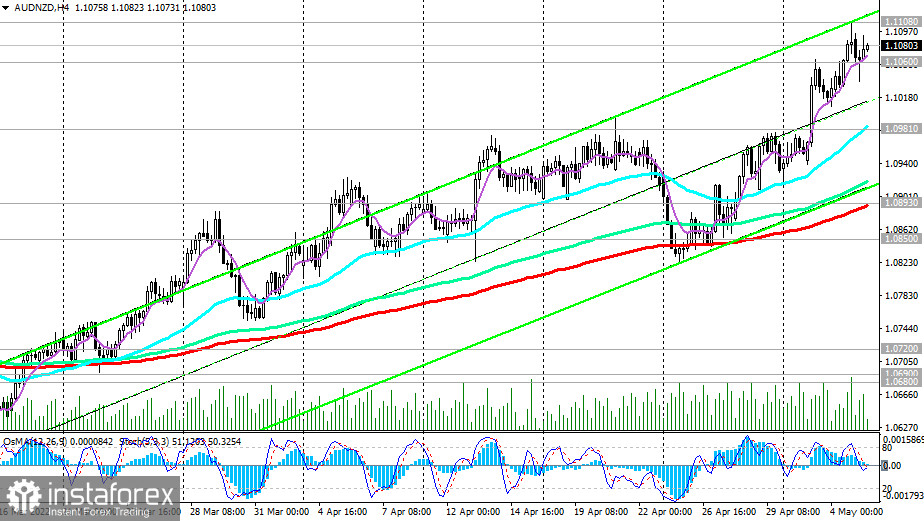
Alternatively, there will be a reversal from the current levels, and the first signal to open short positions will be a breakdown of the support levels of 1.1060 and 1.1050 (200 EMA on a 15-minute chart). A breakdown of the support level 1.0981 (200 EMA on the 1-hour chart) will be a confirming signal. In this case, the targets of the downward correction will be the support levels of 1.0893 (200 EMA on the 4-hour chart and the lower line of the ascending channel on the daily chart),1.0850 (50 EMA on daily chart).
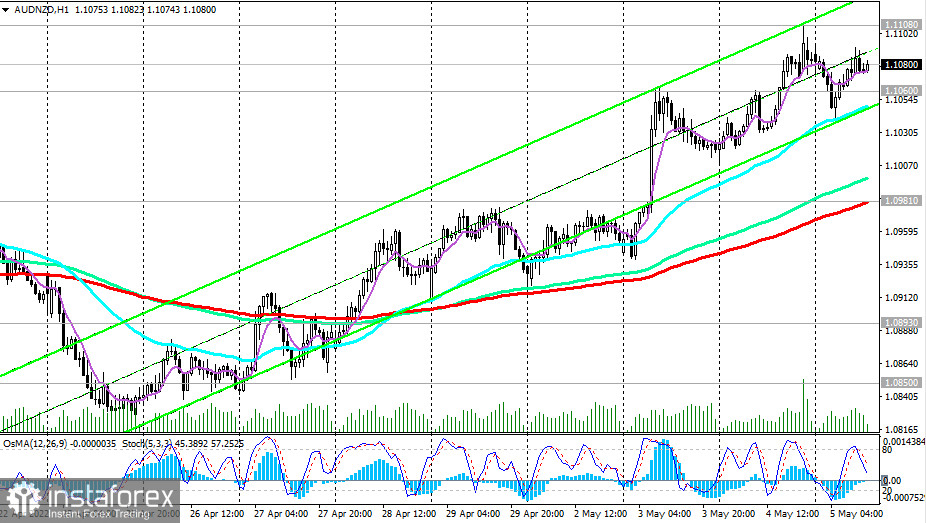
Support levels: 1.1060, 1.1050, 1.1000, 1.0981, 1.0893, 1.0850, 1.0720, 1.0690, 1.0680, 1.0540
Resistance levels: 1.1108, 1.1200, 1.1230
Trading tips
Sell Stop 1.1030. Stop-Loss 1.1095. Take-Profit 1.1000, 1.0981, 1.0893, 1.0850, 1.0720, 1.0690, 1.0680, 1.0540
Buy Stop 1.1095. Stop-Loss 1.1030. Take-Profit 1.1108, 1.1200, 1.1230
 English
 Русский
 Bahasa Indonesia
 Bahasa Malay
 ไทย
ไทย Español
 Deutsch
 Български
 Français
 Tiếng Việt
 中文
中文 বাংলা
বাংলা हिन्दी
 Čeština
 Українська
 Română

