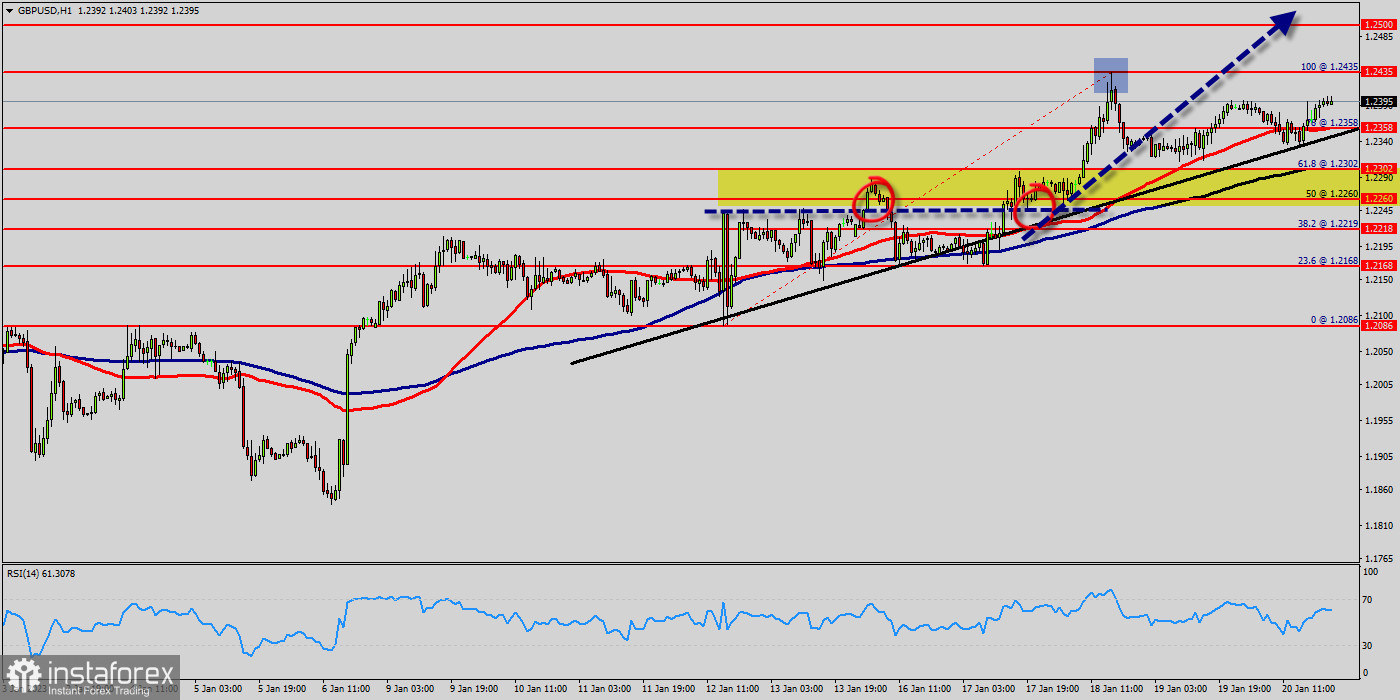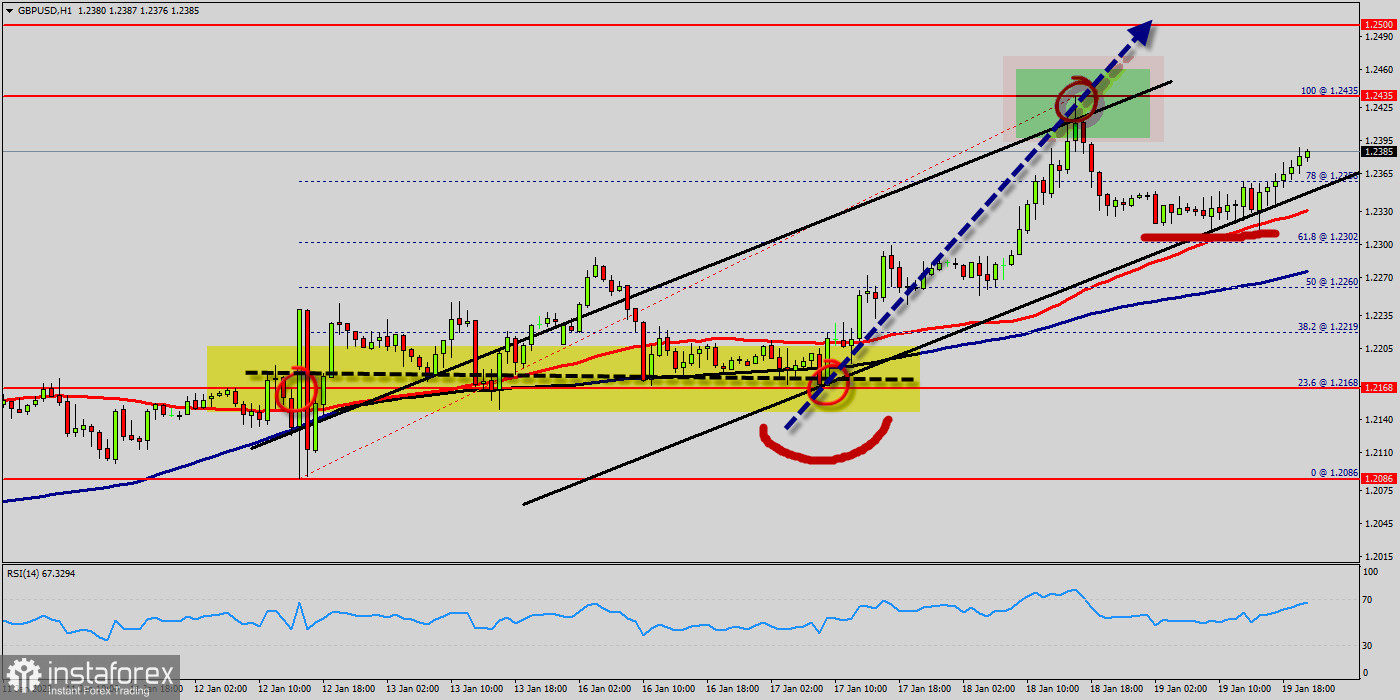
It will be advantageous to buy above the support area of 1.2302. Therefore, the price is expected to reach a high once again. It is rather gainful to buy at 1.2302 with the targets at 1.2435 and 1.2500. So, it is recommended to place take profit at the price of 1.2500 as the second target today. The market is indicating a bullish opportunity above the above-mentioned support levels, for that the bullish outlook remains the same as long as the 100 EMA is headed to the upside. On the contrary, stop loss should be placed at the price of 1.2302 (below the daily support). The bullish outlook remains the same as long as the RSI indicator is pointing to the upside on the one-hour chart. However, if the GBP/USD pair fails to break through the resistance level of 1.2435 today, the market will decline further to 1.2168 in coming days.

The GBP/USD pair remains up for the day, trading at around 1.2336. Renewed US Dollar demand pushed the pair away from an intraday high of 1.2435, its highest in a month. The UK annualized Consumer Prices Index came in at 10.5% in last month easing from 10.7% nowadays. Current price sets at the price of 1.2336.
The double bottom is also coinciding with the major support this week. Additionally, the RSI is still calling for a strong bullish market as well as the current price is also above the moving average 100. Therefore, it will be advantageous to buy above the support area of 1.2241. Commonly, traders use the RSI (Relative Strength Index) to define what? Areas that are potentially overbought or oversold.
Overall, RSI readings below 30 indicate that the pair is oversold, while RSI readings over 70 indicate that it is overbought. Buyers would then use the next resistance located at 1.2315 as an objective. Crossing it would then enable buyers to target 1.2305 (the double top - last bullish yesterday). Be careful, given the powerful bullish rally underway, excesses could lead to a possible correction in the short term. If this is the case, remember that trading against the trend may be riskier.
It would seem more appropriate to wait for a signal indicating reversal of the trend. The GBP/USD pair price could be awaiting a major upswing if the digital savings manages to slice above a fatal line of the first resistance that sets at the price of 1.2315 (Horizontal red line). Re-buy orders are recommended above the major resistance rates of (1.2315) with the second target at the level of 1.2393. Furthermore, if the trend is able to breakout through the second resistance level of 1.2393. We should see the pair climbing towards the next target of 1.2400 The pair will move upwards continuing the development of the bullish trend to the level 1.2425. It might be noted that the level of 1.2425 is a good place to take profit because it will form a new double top in coming hours.
The general bullish opinion of this analysis is in opposition with technical indicators. As long as the invalidation level of this analysis is not breached, the bullish direction is still favored, however the current short-term correction should be carefully watched. The bulls must break through 1.2315 in order to resume the uptrend. Next target 1.2600 in coming days.
 English
 Русский
 Bahasa Indonesia
 Bahasa Malay
 ไทย
ไทย Español
 Deutsch
 Български
 Français
 Tiếng Việt
 中文
中文 বাংলা
বাংলা हिन्दी
 Čeština
 Українська
 Română

